- 340B Impact Overview
- Performance Overview Page
- Drug Spend Page
- Hospital Savings Page
- Net WAC Impact Page
- Retail Performance Page
- Generics Optimization Page
- Mixed Use Optimization Page
- Orphan Optimization Page
- 340B Impact Education Videos
- Account Table Page
-
Updates & Announcements
-
340B Architect
-
340B Impact
-
340B RxCorrelate
-
340B Monitor
-
340B Written Location
-
340B Central Split
-
All About Architect Webinar Series
-
More Resources
-
Right Side Callout
-
Release notes
-
Recent Manufacturer Notices
-
More Videos
Overview
The Retail Performance page provides insight to your 340B Program net benefit for retail pharmacies across your health system. This page includes hospital-owned retail/specialty and contract pharmacy data. Health systems without retail pharmacies will not see this page.
For Third Party Integrated System (TPIS) PIDs, only claims that have been confirmed by the TPIS provider will be invoiced and included on the Retail Performance page.
On this page you can interact directly with the data in the visuals by hovering over any data point to display more details. Selecting one or more data points updates Current Filters and dynamically updates all visuals.
Learn more about 340B Impact navigation and interaction functions in the article “How to Use 340B Impact”.
Key Metrics
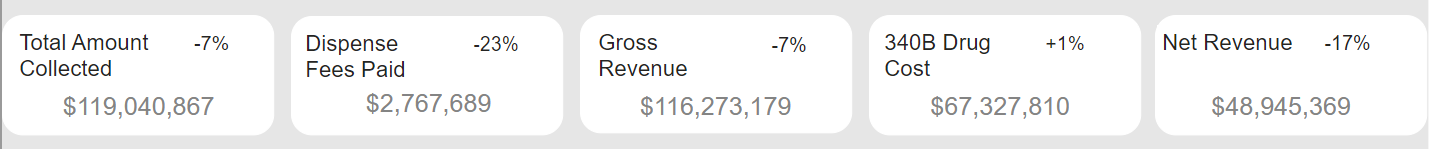
Key Metrics show a high-level overview of your retail pharmacy 340B Program performance. All metrics include hospital-owned retail/special pharmacy and contract pharmacy data.
- Total Amount Collected: Amount collected by all retail pharmacies, prior to any deductions.
- Dispense Fees Paid: Amount paid by the hospital in dispensing fees to the retail pharmacy.
- Gross Revenue: Total amount collected from the retail pharmacy, minus dispensing fees.
- 340B Drug Cost: Cost listed in Utilization Manager for the qualified prescription based on the price in the 340B drug catalog. This may not tie back to an actual purchase.
- Net Revenue: Hospital's net benefit from its contract pharmacies. This is Gross Revenue minus any associated 340B Drug Cost the hospital would incur. This does not include Macro Helix testing fees.
The percentage change represents the difference between the start and end data points for the selected date range.
Capture Rate
This graph displays the percentage of 340B-qualified prescriptions from the total prescription volume, showing qualification rate trends over time. Total Capture Rate is the percentage of dispenses that qualified for 340B including by Written Location and TPIS captured claims. Written Location Capture Rate is the percentage of dispenses that only qualified for 340B by Written Location. You can choose to view this graph by Total Capture Rate or the Written Location Capture Rate.
- Dispense Date: Represents capture rate data based on the dispense date.
- Qualified Date: Represents capture rate data based on the qualified date.
- Dotted lines: Represent the average trend across data points for the selected date range.

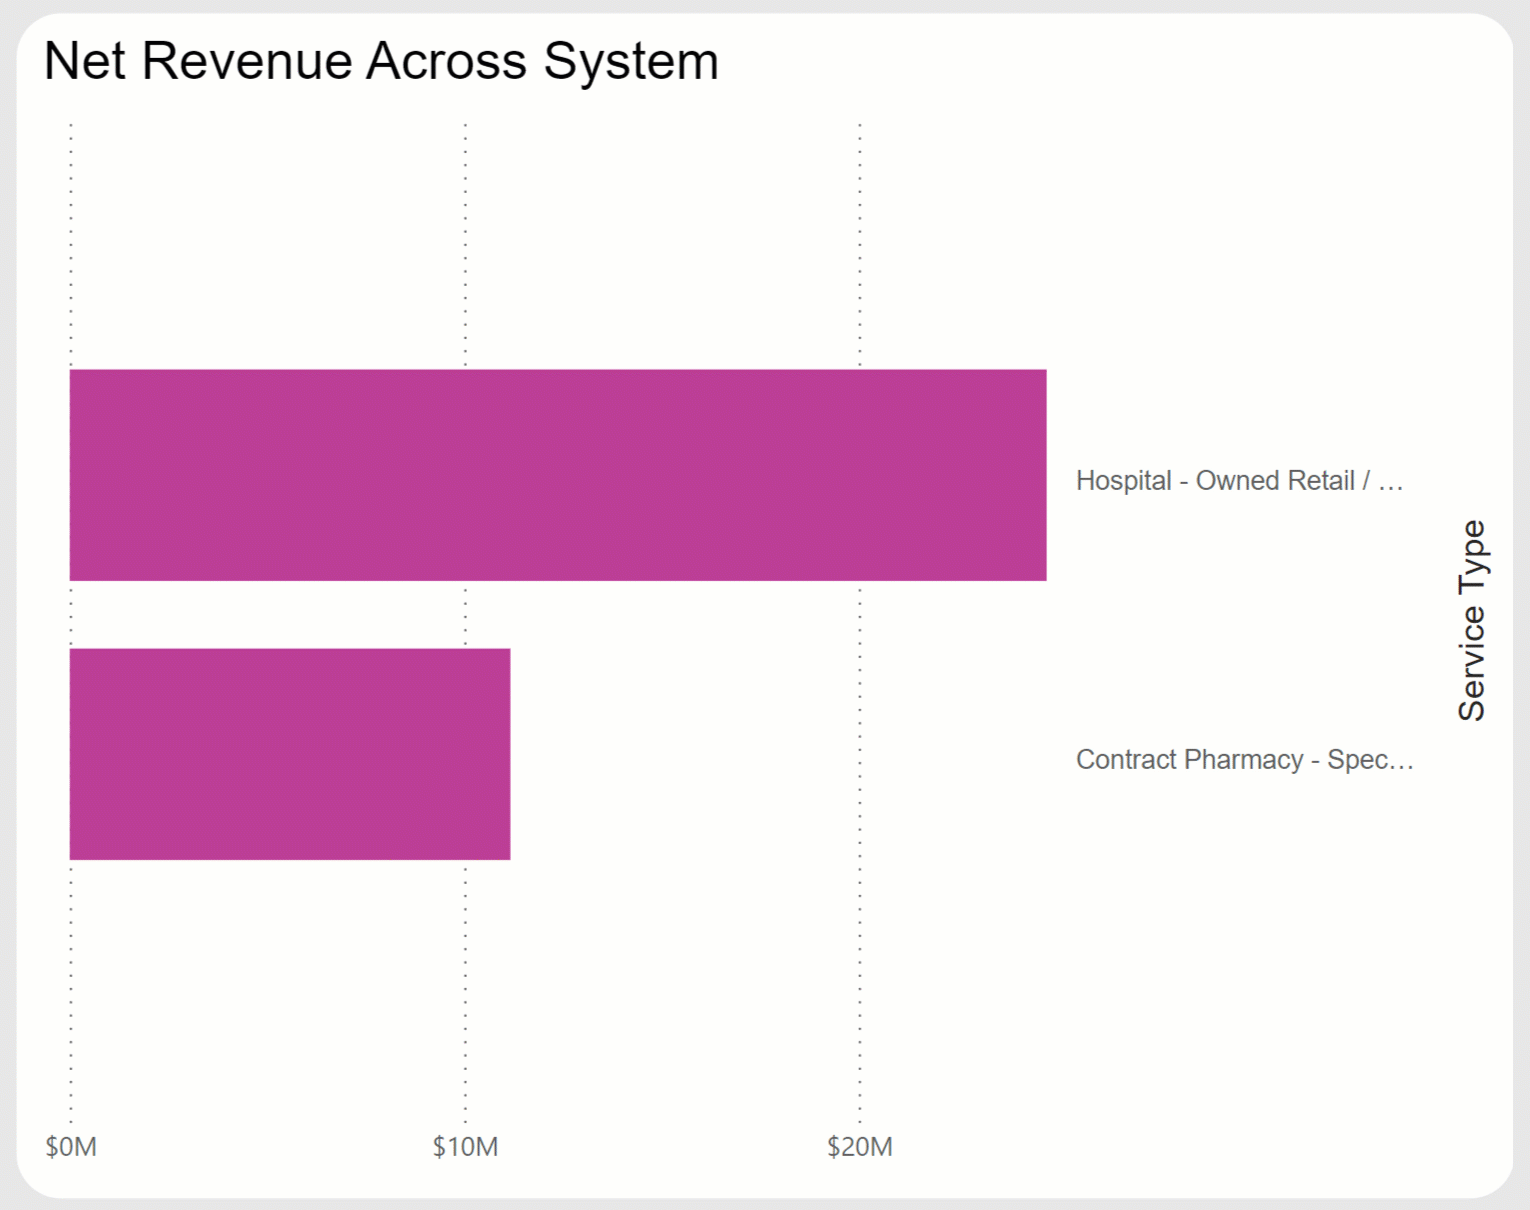
Net Revenue Across the System
This graph shows the total amount of retail net revenue across your health system. You can use the drill-down feature to isolate areas of your health system that are driving net revenue and see the details.
Health System Hierarchy
- Hospital: Covered entity(s) that are part of your health system that are participating in the 340B Program.
- Service Type: Identifies different standard areas of your health system’s 340B program, including hospital mixed-use, hospital ambulatory, hospital-owned retail, contract pharmacy retail, contract pharmacy specialty, etc.
- Location: Contract pharmacy chains are grouped together. Customers may also choose to group their hospital outpatient pharmacies together using their account table setup.
- PID: A unique identifier assigned by Macro Helix to identify pharmacies.
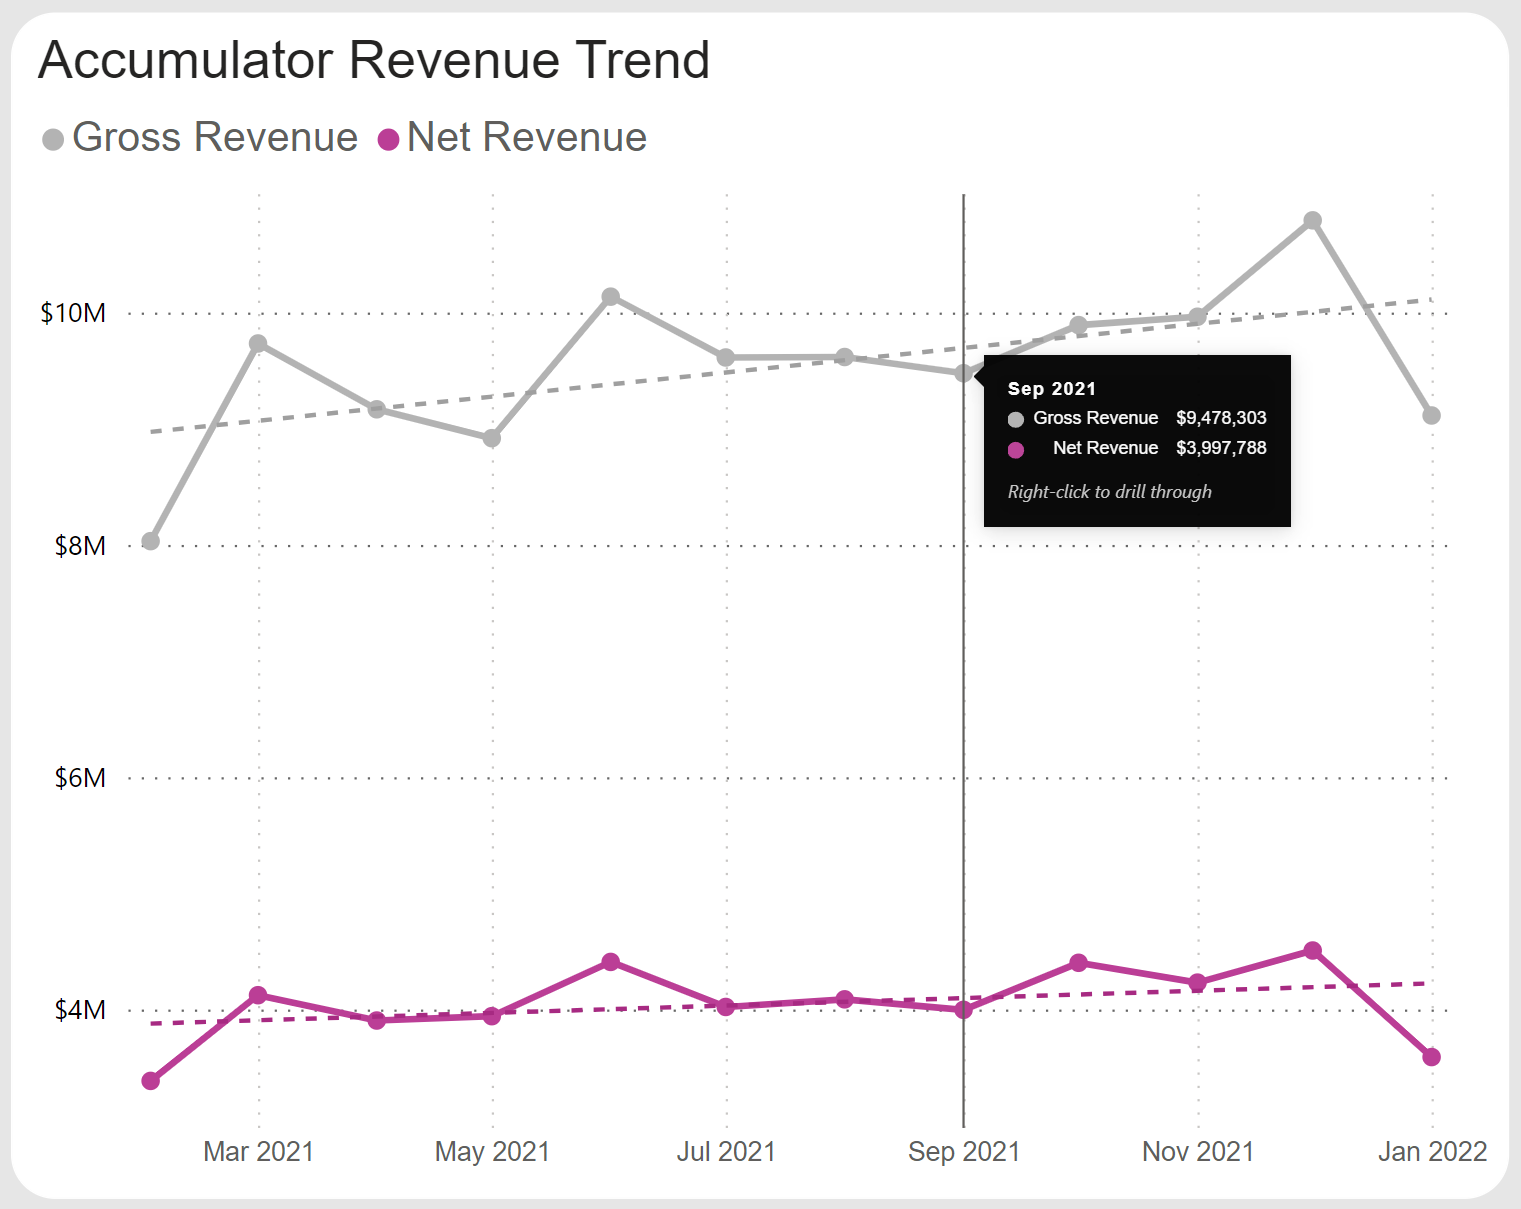
Accumulator Revenue Trend
This graph displays the relationship between Gross Revenue and Net Revenue over time and shows how the 340B Drug Cost can affect the Net Revenue. These analytics correspond with 340B accumulation values for all dispenses reported in 340B Architect/Utilization Manager.
It is possible that the revenue for these accumulations are not yet invoiced.
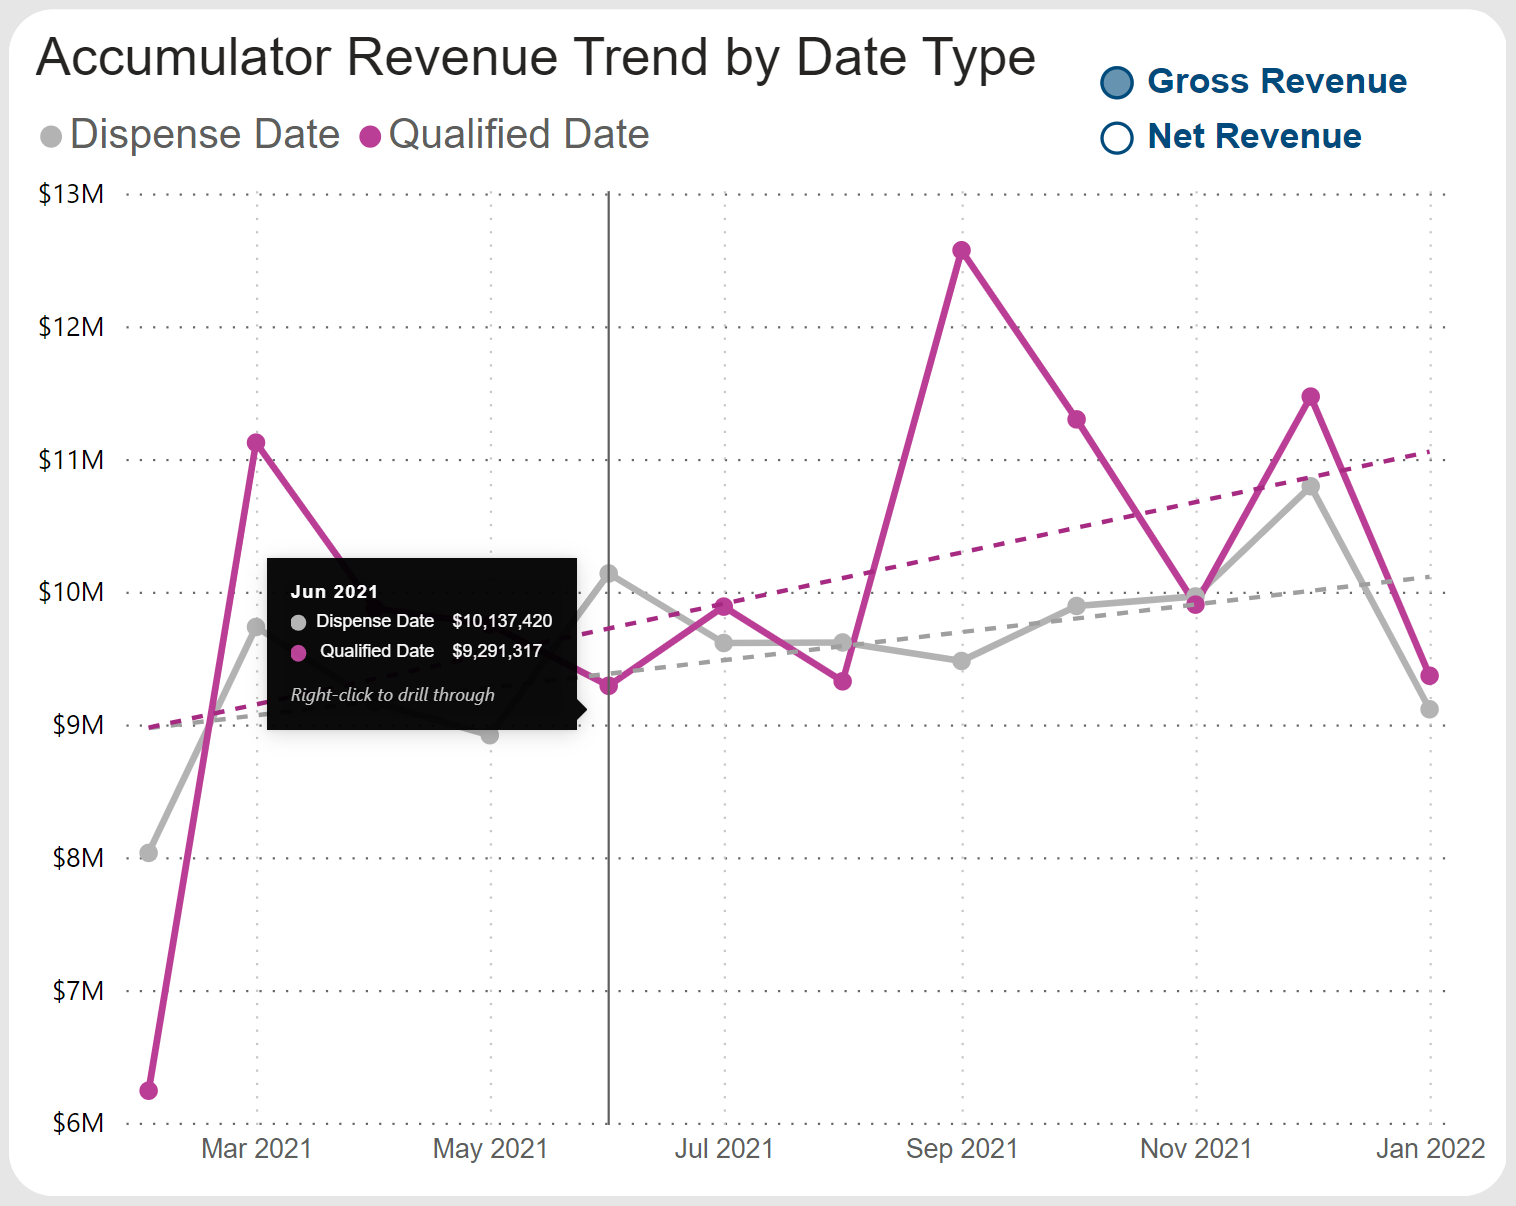
Accumulator Revenue Trend by Date Type
This graph contrasts revenue trends of 340B accumulations by Dispense and Qualified Date over time. In your analysis you can see how the accumulated revenue is affected by program settings (rules, prescribers, etc.) and retroactive retesting. You have the choice to view this graph by Gross Revenue or Net Revenue.
- Dispense Date: Displays the selected revenue across months based on when the 340B prescriptions were dispensed
- Qualified Date: Displays the selected revenue across months based on when the 340B prescriptions were qualified.
- Dotted lines: Represent the average trend across data points for the selected date range. See the graph key to find what metrics the dotted line represents.
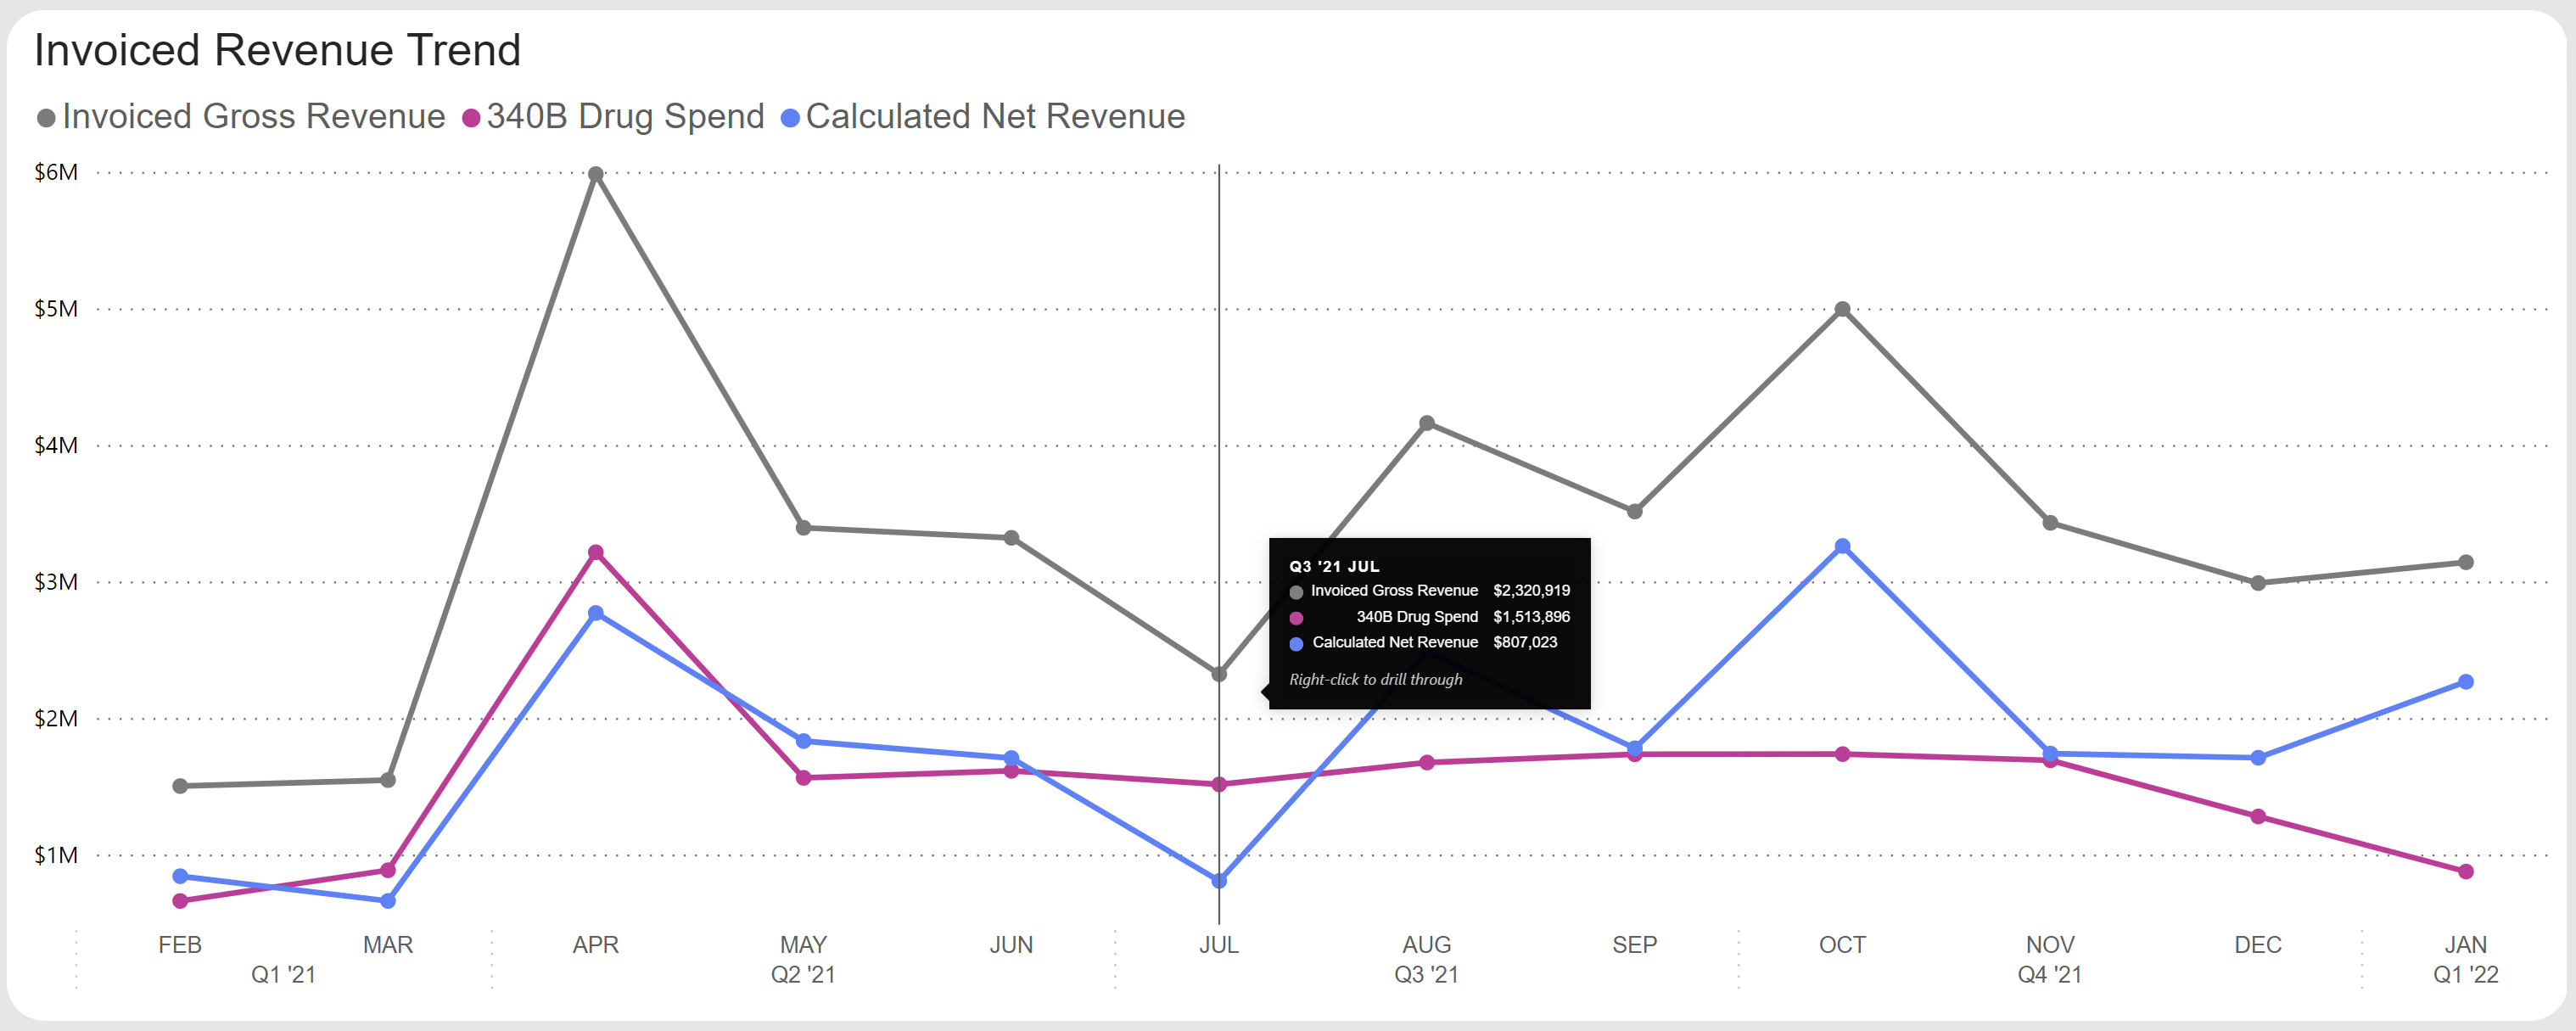
Invoiced by Revenue Trend
Metrics in this graph are associated with your 340B Architect contract pharmacy invoices and provides insight into your contract pharmacy(s) performance. The line graph contrasts Invoiced Gross Revenue, 340B Drug Cost, and Calculated Net Revenue providing a cash flow perspective.
Invoiced Gross Revenue: Total dollar amount from the Macro Helix contract pharmacy invoice.
- Pharmacies that are invoiced by pay-on replenishment may have a lower Invoiced Gross Revenue than Gross Revenue.
- If invoice details are not confirmed for TPIS PIDs they will not be included.
340B Drug Spend: Amount spent to replenish drugs for your health system’s contract pharmacies. The 340B Drug Spend amount comes from the invoiced drug purchases.
Calculated Net Revenue: Your health system’s benefit from contract pharmacy relationships. This amount is Invoiced Gross Revenue minus 340B Drug Spend.
Drug Detail
This table displays the Gross Revenue, Net Revenue, and the number of Qualified Scripts for the selected date range within the drug hierarchy. This allows you to isolate what drugs or drug categories might be driving retail trends.
As a reminder all Current Filters affect the data displayed in this table.
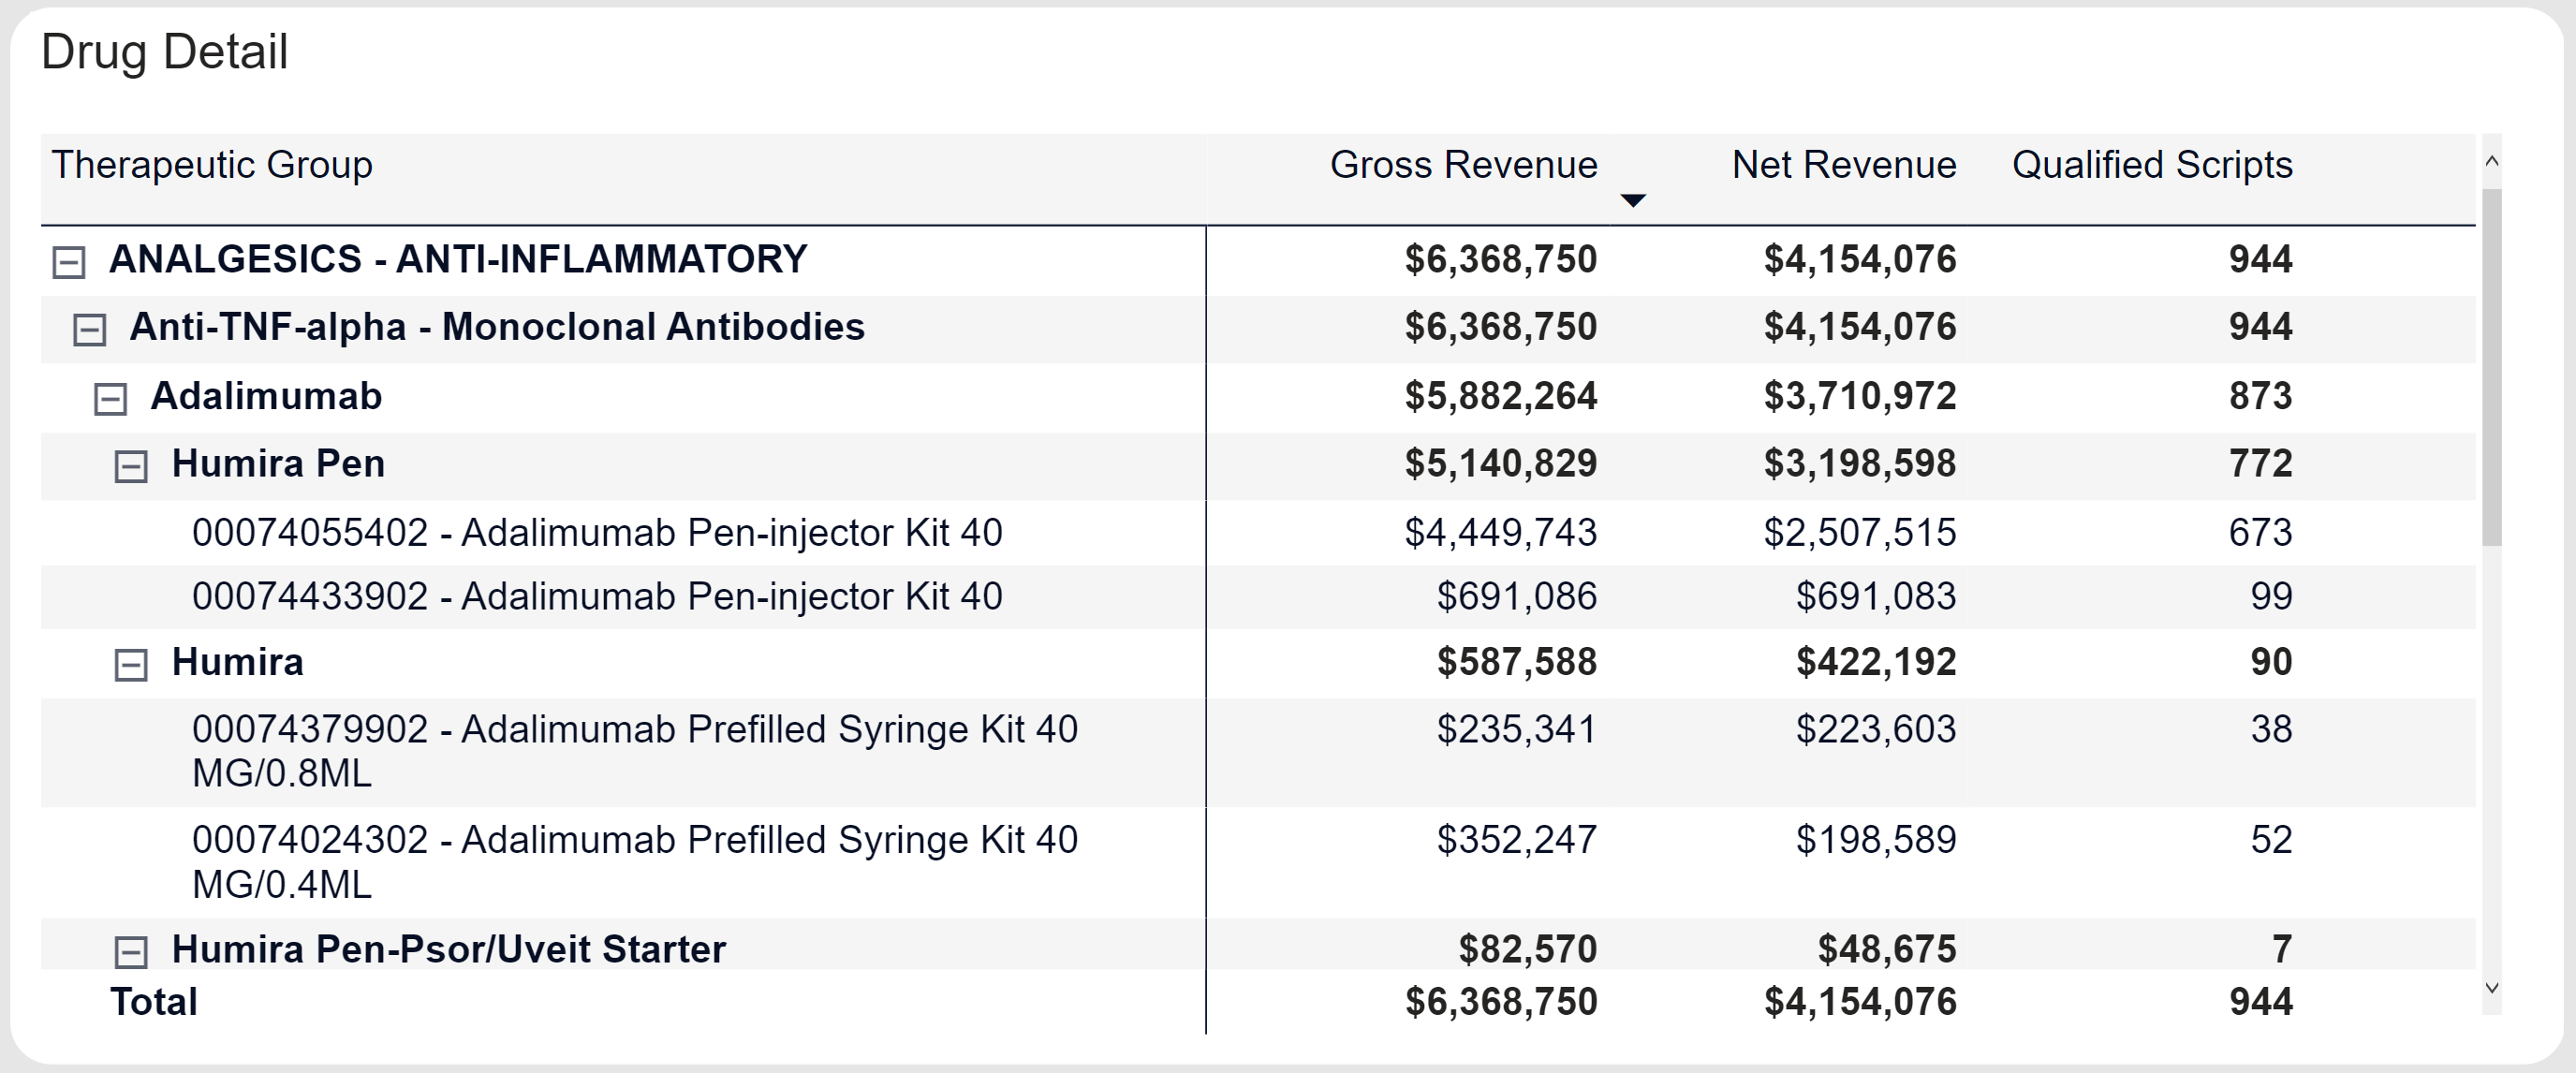
Drug Category Hierarchy
- Therapeutic Group: General drug groups frequently used in general market research and third-party prescription processing, for example, Penicillins, Contraceptives, and Anti-Diabetics.
- Therapeutic Class: Specific therapeutic drug classes designed to accommodate more detailed market research, for example, Carbonic Anhydrase Inhibitors, Loop Diuretics, and Mercurial Diuretics.
- Drug Name: The generic or chemical name of a drug, for example, Dexamethasone Acetate, and Dexamethasone Sodium Phosphate.
- Brand Group: The brand name of a drug when applicable.
- NDC: 11-digit unique drug identifier; the level at which accumulations are maintained in 340B Architect.
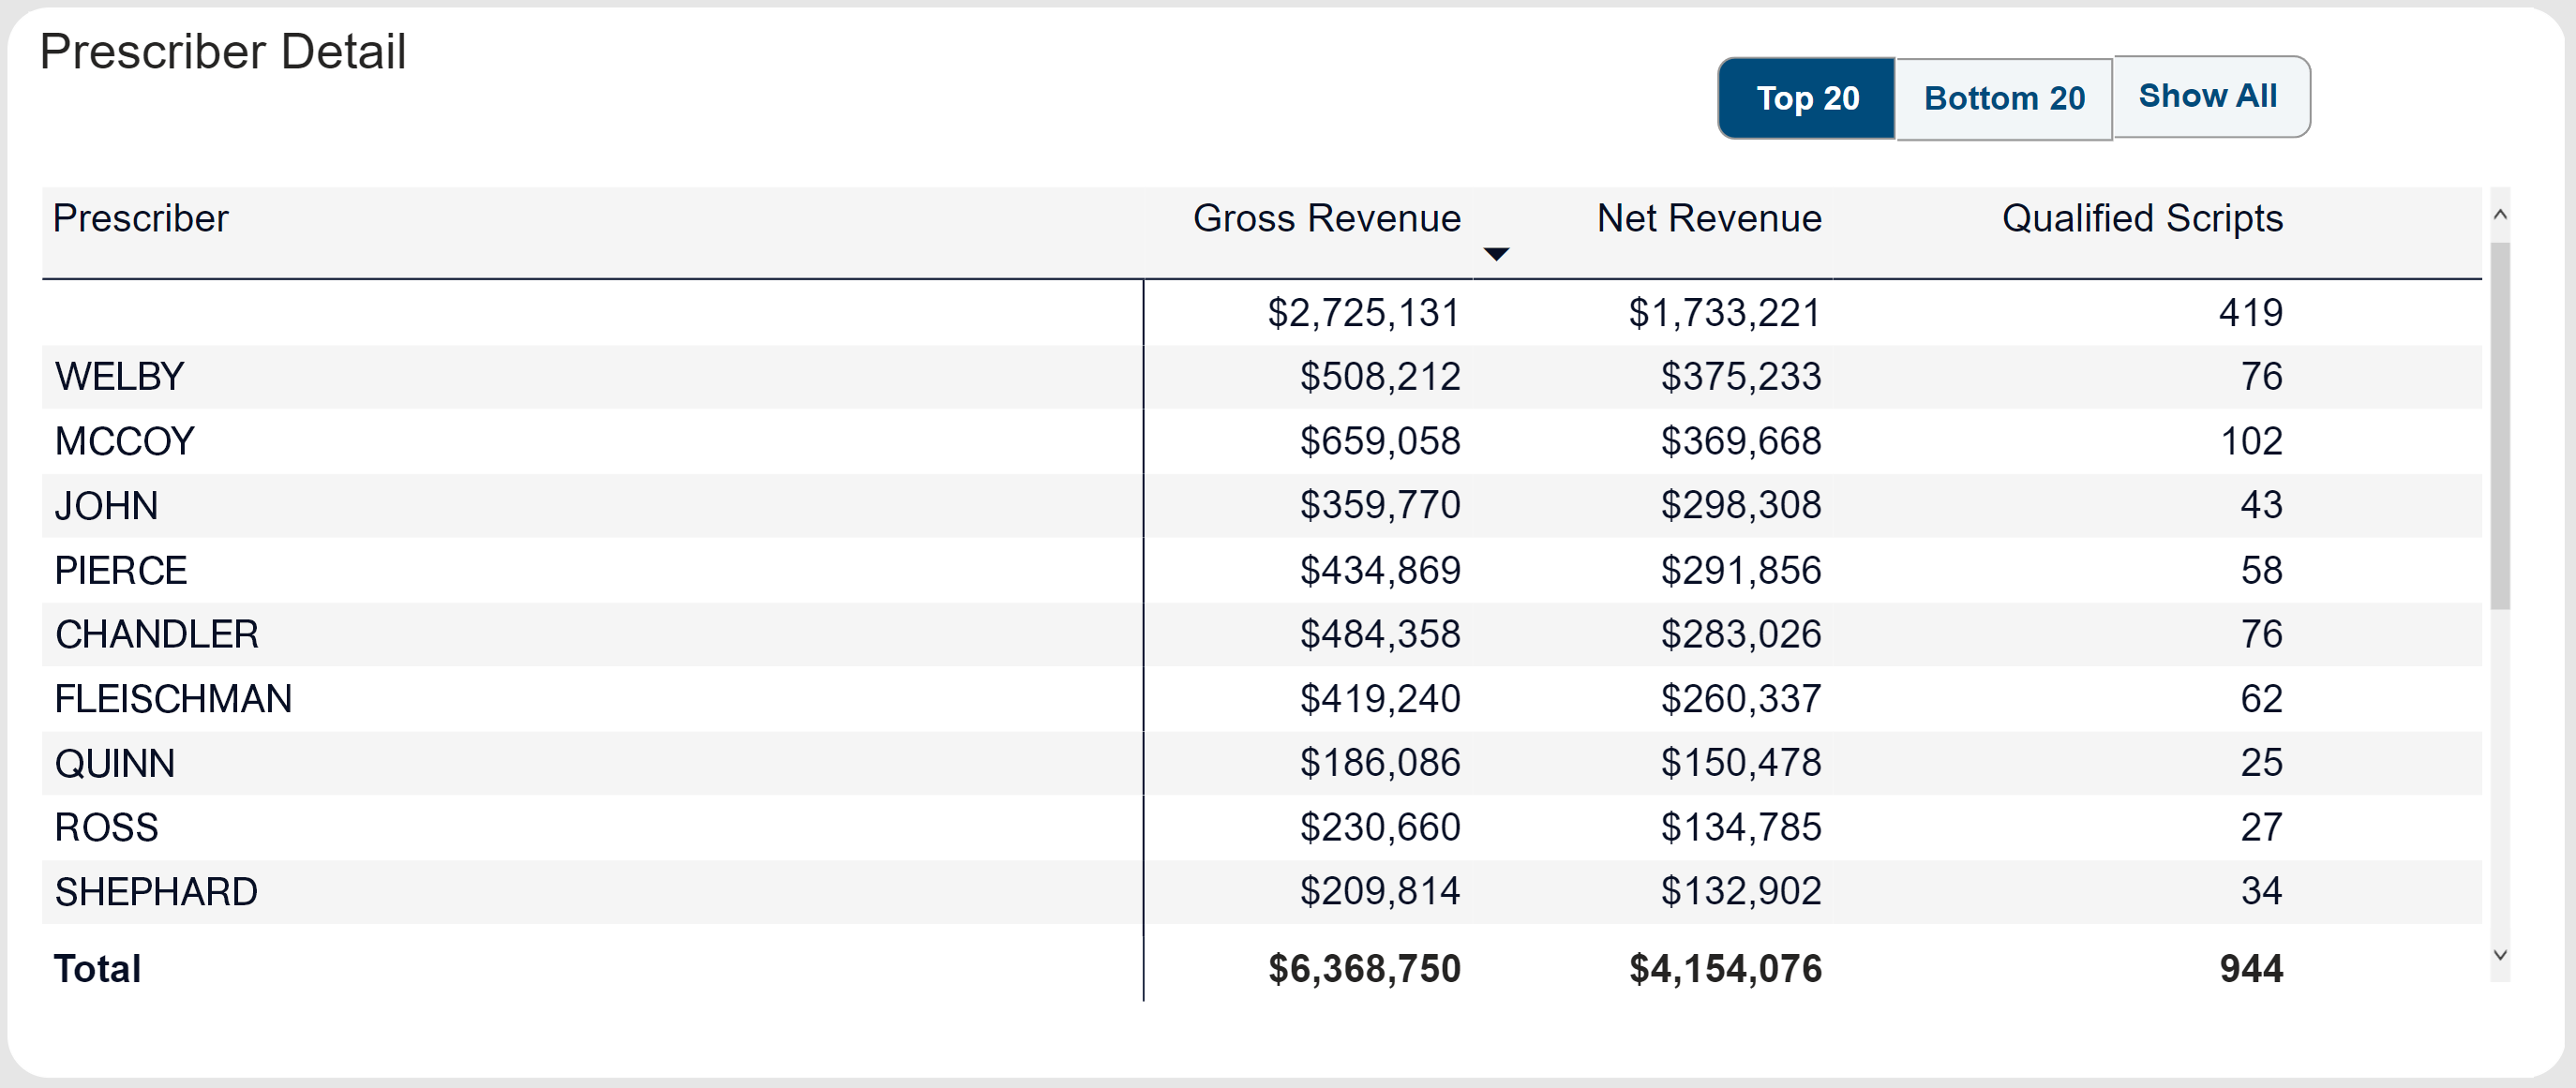
Prescriber Detail
This table displays the Gross Revenue, Net Revenue, and Qualified Scripts by Prescriber Name and Prescriber NPI/DEA, allowing you to isolate which prescribers may be driving retail qualifications.
You can select to view prescribers by Top 20, Bottom 20, or Show All. The Top 20 and Bottom 20 are determined by Net Revenue.
The Prescriber name is pulled from Utilization Manager which is the data provided by the retail pharmacy dispense data. The Prescriber field will be blank for a Qualified Script when a prescriber value is not available in the dispense data.
As a reminder all Current Filters affect the data displayed in this table.
 340B Impact Filters Defined