- 340B Impact Overview
- Performance Overview Page
- Drug Spend Page
- Hospital Savings Page
- Net WAC Impact Page
- Retail Performance Page
- Generics Optimization Page
- Mixed Use Optimization Page
- Orphan Optimization Page
- 340B Impact Education Videos
- Account Table Page
-
Updates & Announcements
-
340B Architect
-
340B Impact
-
340B RxCorrelate
-
340B Monitor
-
340B Written Location
-
340B Central Split
-
All About Architect Webinar Series
-
More Resources
-
Right Side Callout
-
Release notes
-
Recent Manufacturer Notices
-
More Videos
Overview
The Hospital Savings page consists of savings analytics for your health system showing the net benefit from participating in the 340B program. This allows you to view your data from the entire health system down to individual accounts. The Hospital Savings page includes hospital and hospital-owned retail/specialty pharmacy data. Contract pharmacy data is excluded from this page.
The Net Savings total reflects the difference of the cost in purchasing drugs through the 340B and WAC accounts when compared with GPO pricing. This analysis is only calculated for purchases where GPO reference pricing is available.
On this page you can interact directly with the data in the visuals by hovering over any data point to display more details. Selecting one or more data points updates Current Filters and dynamically updates all visuals.
Learn more about 340B Impact navigation and interaction functions in the article “How to Use 340B Impact”.
Key Metrics

Key Metrics show a high-level overview of your 340B Program performance. All metrics include your hospital and hospital-owned retail/special pharmacy data. Drug Spend also includes contract pharmacy data in addition to the hospital data.
- Drug Spend: Total amount spent on all drug purchases.
- Gross Savings: The amount saved on all 340B purchases compared to the GPO catalog prices.
- Net WAC Impact: The impact of all WAC purchases compared to the GPO catalog prices.
- Net Savings: The health system's net benefit from participating in the 340B program (Gross Savings plus Net WAC Impact).
The percentage change represents the difference between the start and end data points for the selected date range.
Net Savings Over Time
This graph displays Net Savings trends for the current and prior years for the selected date range. This makes it easy to see the variations in drug savings over time for your health system.
- Current Year: Represents the date range selected.
- Prior Year: Represents data for the year prior to the date range selected.
- Dotted lines: Represent the average trend across data points for the selected date range.

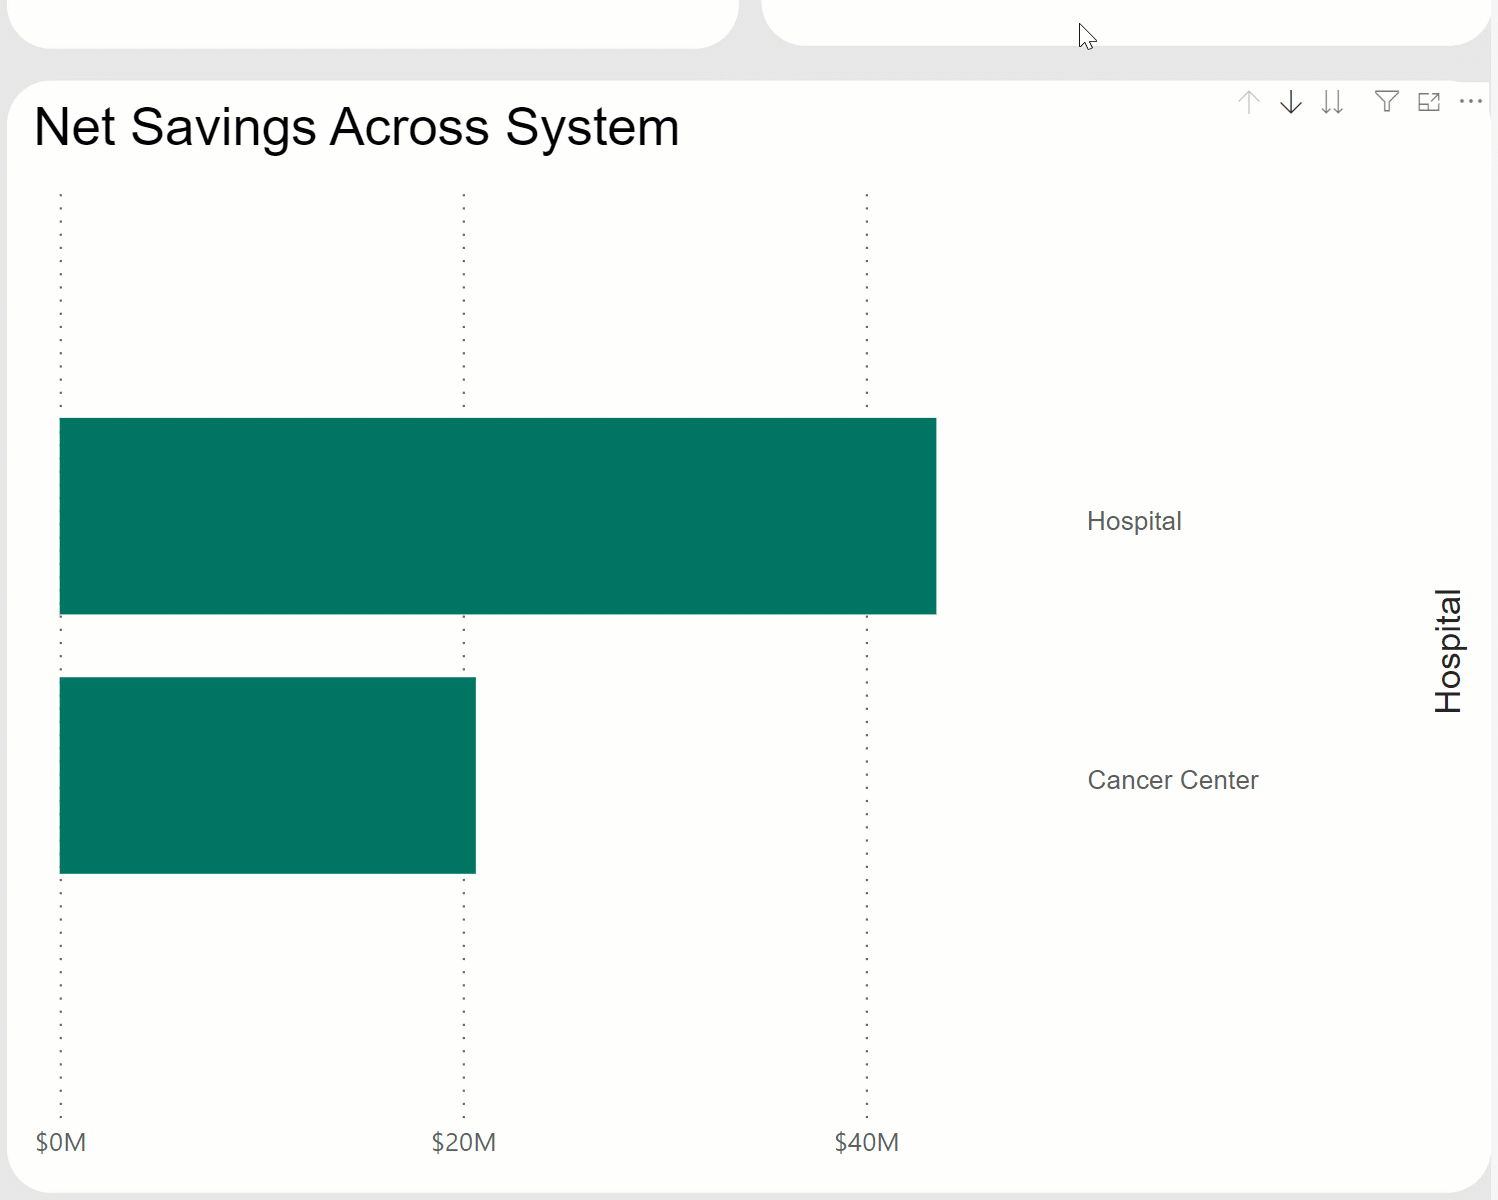
Net Savings Across System
This graph shows the net savings across your health system. You can use the drill-down and expand features to visually isolate areas of your health system and see more granular savings details.
Health System Hierarchy
- Hospital: Covered entities that are part of your health system that are participating in the 340B Program.
- Service Type: Identifies different standard areas of your health system’s 340B program, including hospital mixed-use, hospital ambulatory, hospital-owned retail, contract pharmacy retail, contract pharmacy specialty, etc.
- Location: Contract pharmacy chains are grouped together. Customers may also choose to group their hospital outpatient pharmacies together using their account table setup.
- Account: The individual purchasing account used to purchase drugs for your 340B Program.
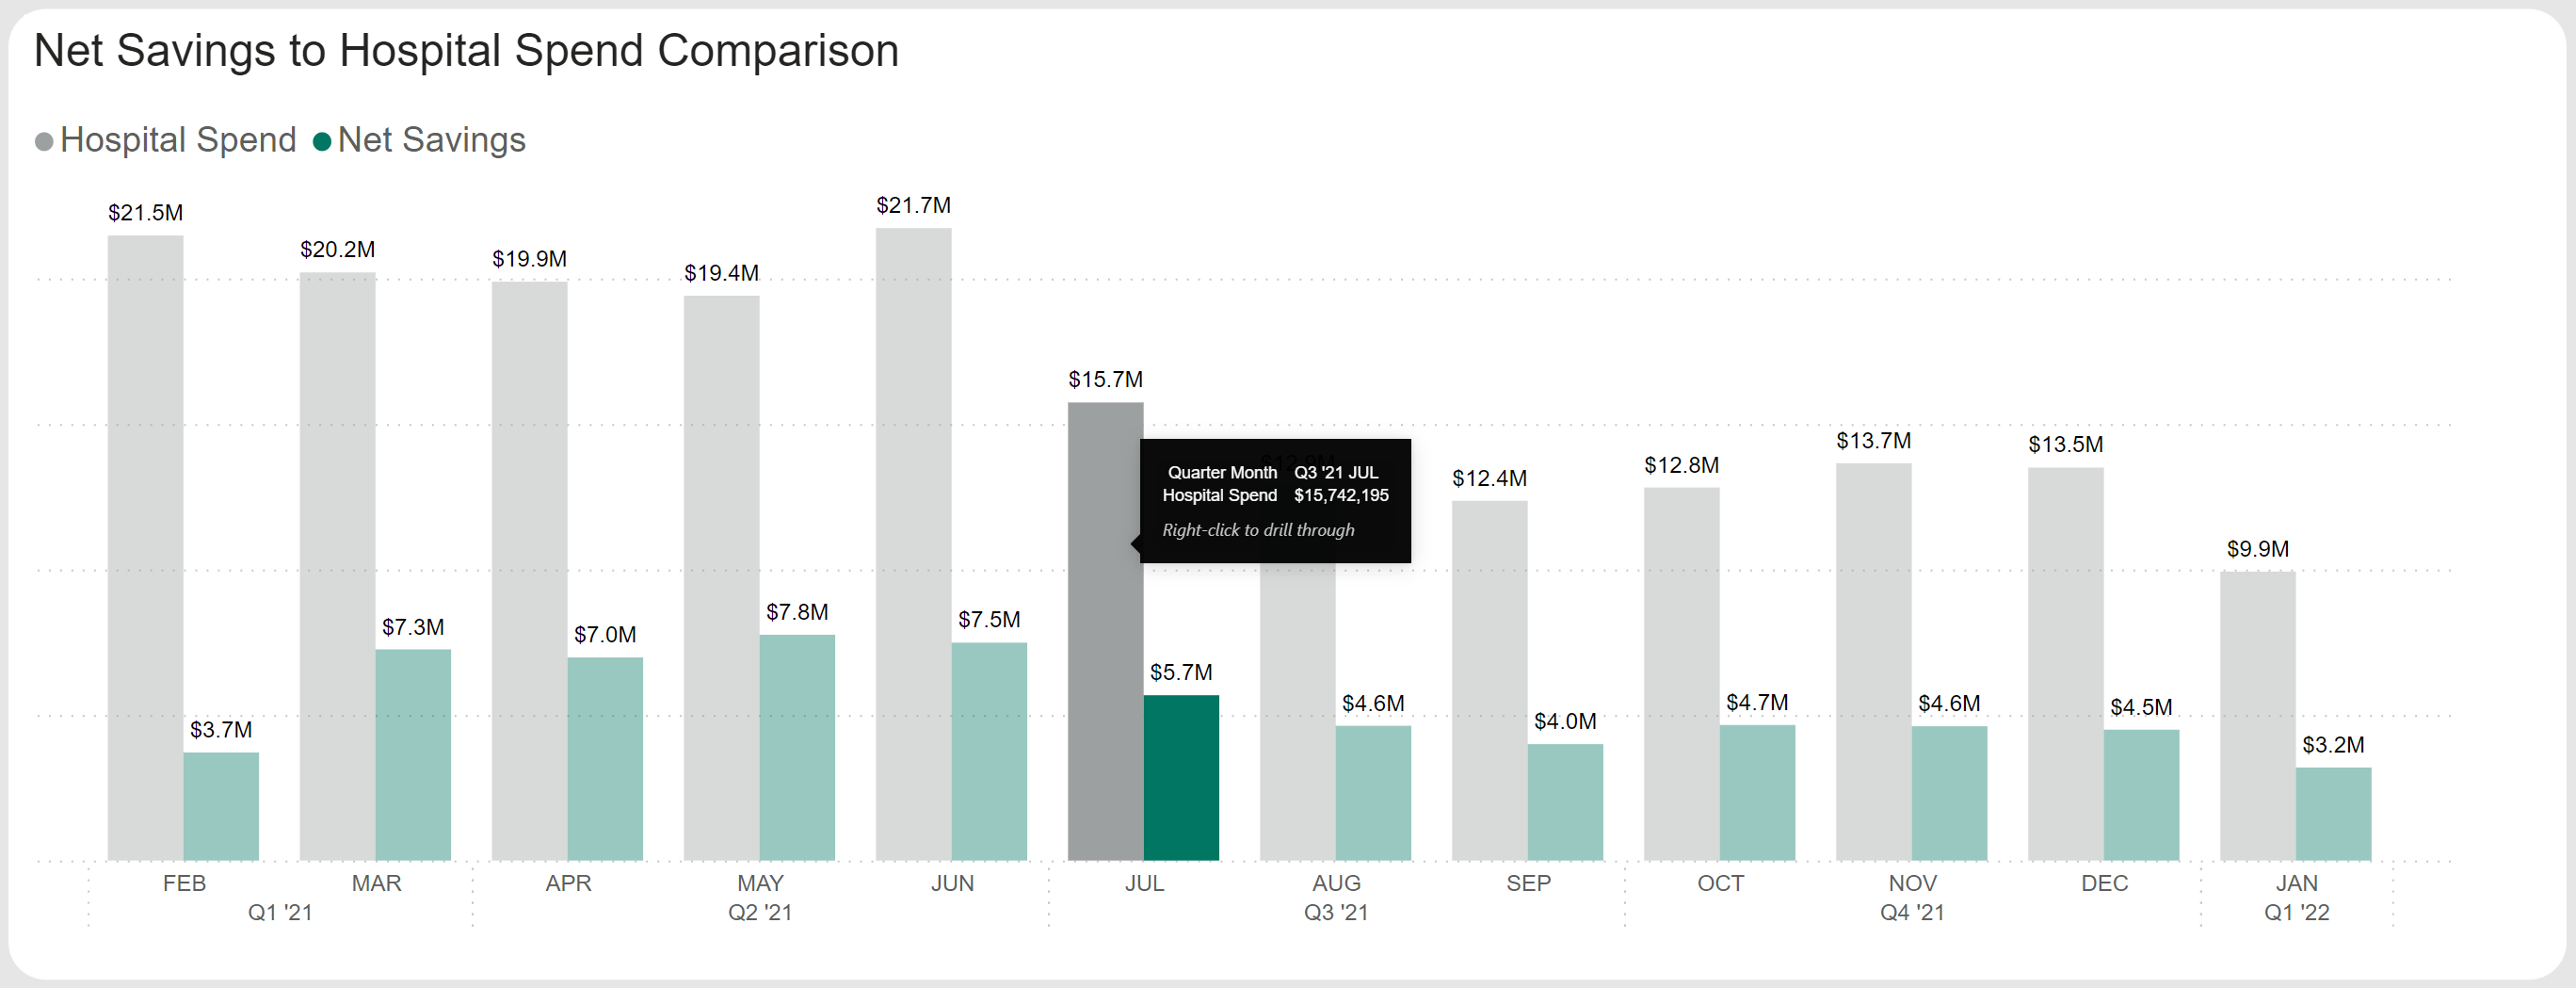
Net Savings to Hospital Spend Comparison
This graph shows a comparison of Net Savings with Hospital Drug Spend trends over time, which allows you to isolate where changes in savings may be driven by overall purchase volume trends.
As a reminder, Net Savings and Hospital Spend only includes hospital and hospital-owned retail/specialty pharmacy data.
Net Savings By Drug/Category
This table displays the Net Savings within the drug hierarchy for the date range selected, allowing customers to isolate which drugs or drug categories may be driving savings trends. Use the expand buttons to view the spend metrics broken out at each level.
As a reminder all Current Filters affect the data displayed in this table.
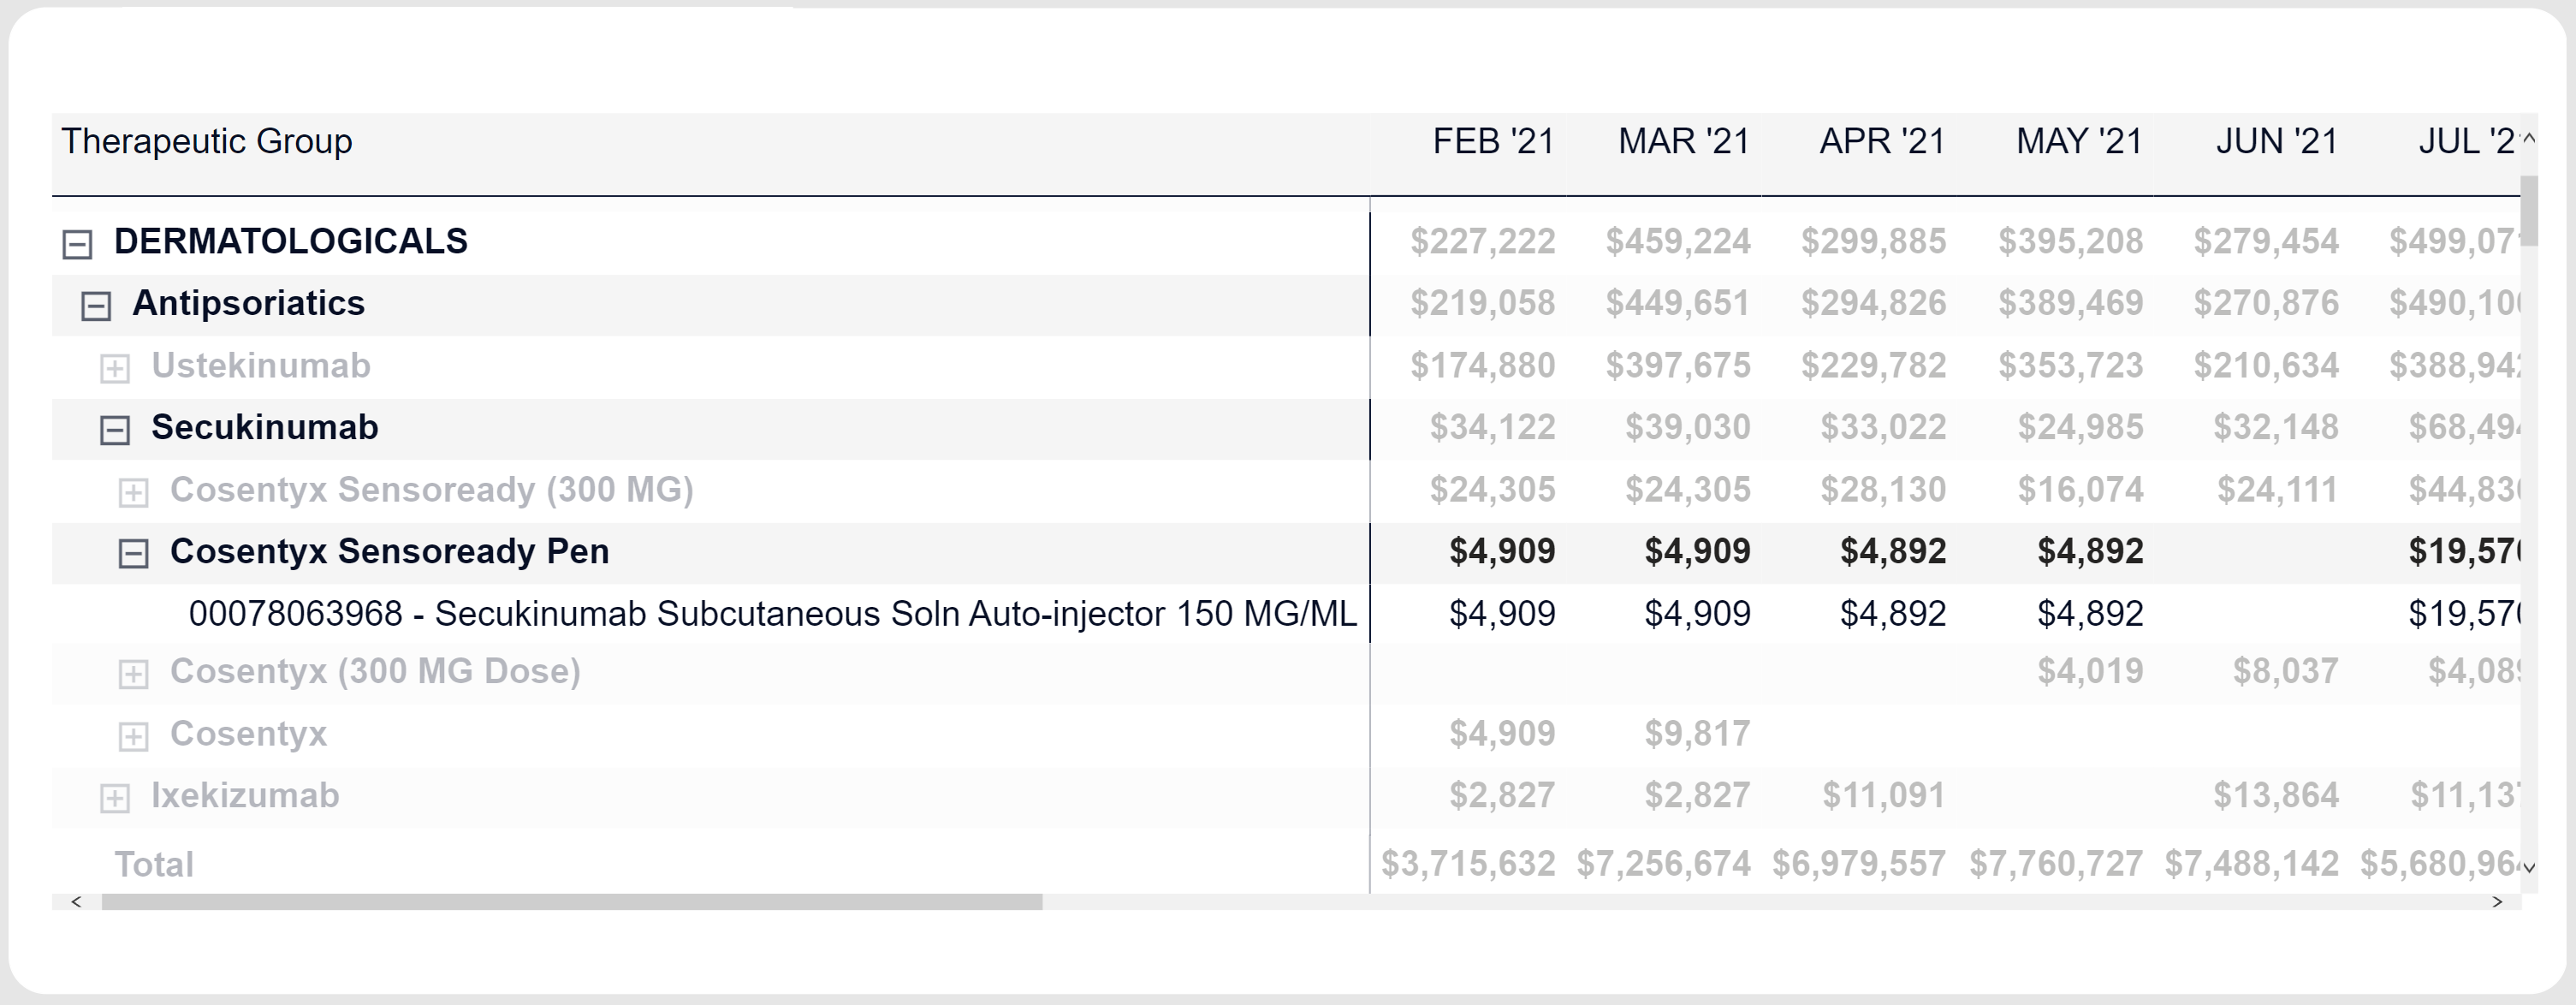
Drug Category Hierarchy
- Therapeutic Group: General drug groups frequently used in general market research and third-party prescription processing, for example, Penicillins, Contraceptives, and Anti-Diabetics.
- Therapeutic Class: Specific therapeutic drug classes designed to accommodate more detailed market research, for example, Carbonic Anhydrase Inhibitors, Loop Diuretics, and Mercurial Diuretics.
- Drug Name: The generic or chemical name of a drug, for example, Dexamethasone Acetate and Dexamethasone Sodium Phosphate.
- Brand Group: The brand name of a drug when applicable.
- NDC: 11-digit unique drug identifier; the level at which accumulations are maintained in 340B Architect.
 340B Impact Filters Defined