- 340B Impact Overview
- Performance Overview Page
- Drug Spend Page
- Hospital Savings Page
- Net WAC Impact Page
- Retail Performance Page
- Generics Optimization Page
- Mixed Use Optimization Page
- Orphan Optimization Page
- 340B Impact Education Videos
- Account Table Page
-
Updates & Announcements
-
340B Architect
-
340B Impact
-
340B RxCorrelate
-
340B Monitor
-
340B Written Location
-
340B Central Split
-
All About Architect Webinar Series
-
More Resources
-
Right Side Callout
-
Release notes
-
Recent Manufacturer Notices
-
More Videos
Overview
Mixed Use Optimization focuses on your health system's McKesson accounts that split orders through 340B Architect PIDs with a goal to identify opportunities to improve your 340B purchasing rate. These analytics are for hospital mixed-use areas only. Other areas and retail pharmacies are excluded.
Opportunities are identified based on consideration of the following factors:
- The percentage of charges for each NDC tested in 340B Architect as both non-Medicaid and Outpatient over the past 90 days, indicating potential eligibility for 340B accumulation
- Total purchase volume over the past 90 days adjusted by the Non-Medicaid Outpatient charge ratio, indicating the potential purchase volume that could have been purchased at 340B
- Actual 340B purchase volume for each NDC over the past 90 days
- Current 340B and default account pricing for each NDC
These analyses can help determine if there are potential missed savings due to charge data and purchase data not aligning, but the cause of the potential opportunity cannot be identified directly by 340B Impact. Additional investigation will be required to understand the discrepancy.
Potential reasons for a variance could include:
- Waste is not being accumulated, causing purchase volume to exceed charge volume
-
Crosswalk issues, including:
- CDMs and charge quantities are not consistent across different areas
- BUPPs are set incorrectly
- Unmatched charges
- Purchases bypassing the split process
- Negative current 340B accumulation balance
- Missing utilization data
- 340B-eligibility exclusions
Realized Savings
Realized Savings is a cumulative amount of actual savings for tracked mixed-use opportunities. This means, for every opportunity in the Current Opportunities list, 340B Impact compares the new and baseline 340B purchase ratios over time. As the percentage of 340B purchases increases, improvement is quantified by comparing 340B and default account prices. By default, the Realized Savings amount displayed is the sum of all PIDs with tracked opportunities. This amount will automatically update when a PID is selected from the Savings Opportunity by PID table.

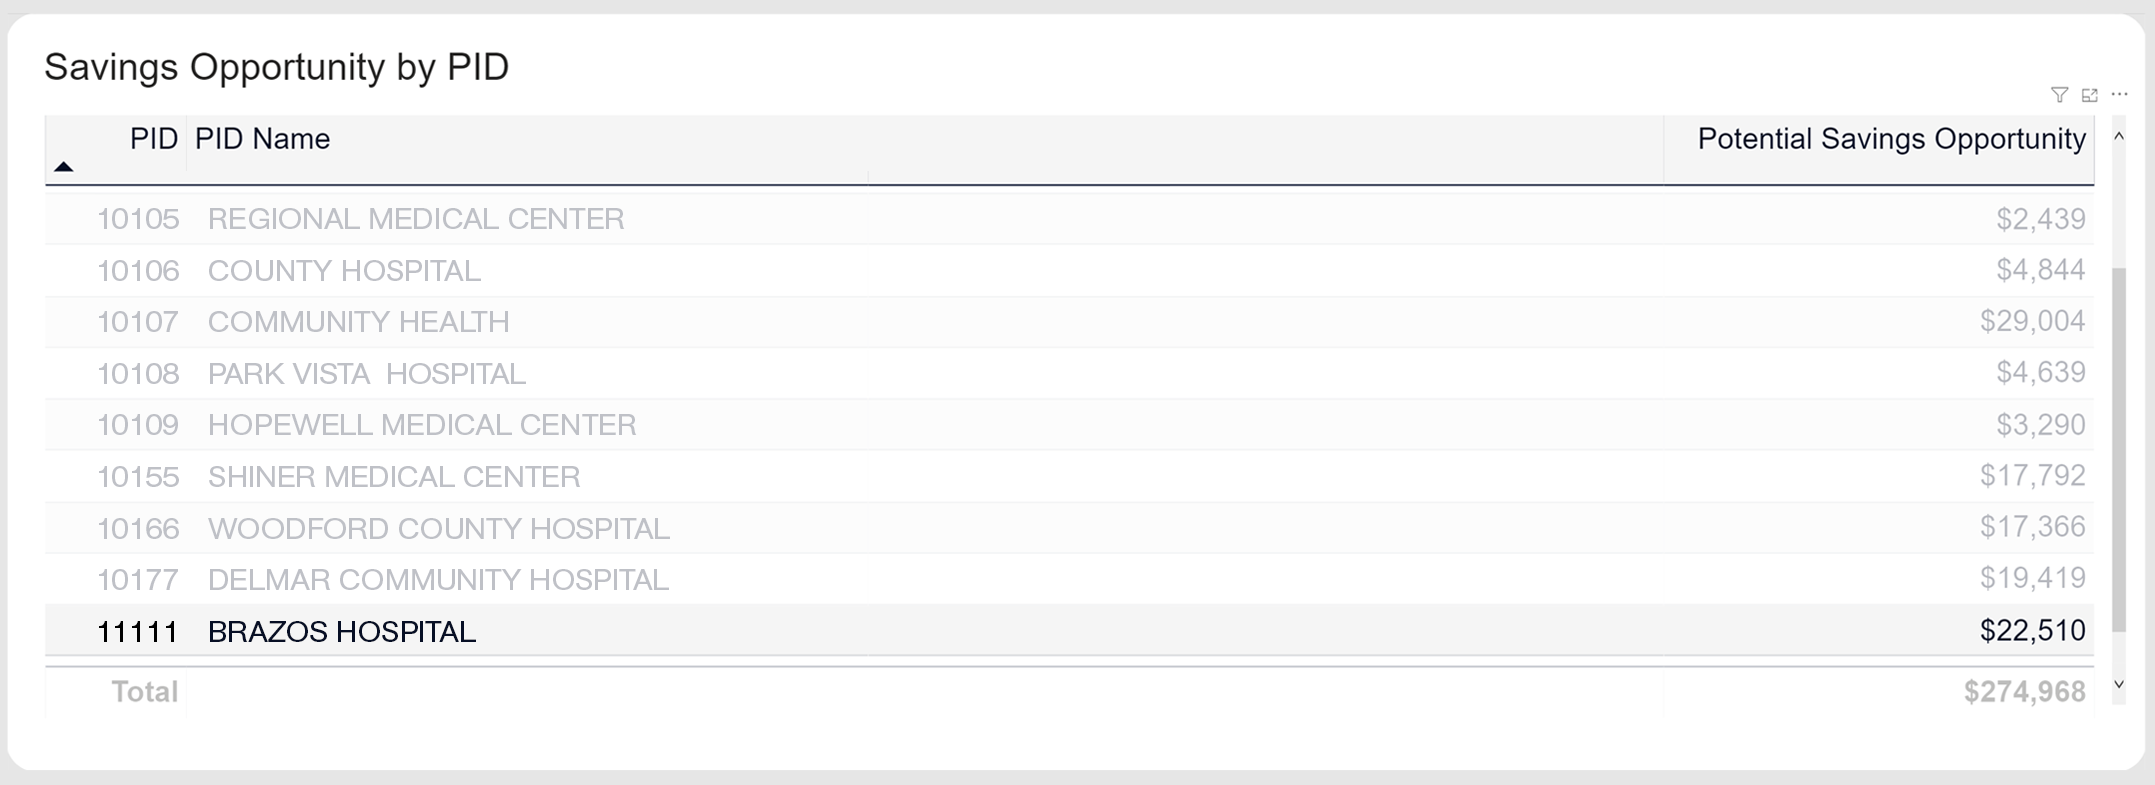
Savings Opportunity by PID
This table displays PIDs with active Potential Savings Opportunities. A PID must be selected to view the opportunities in the sections below. By default, this table is sorted by highest value of Potential Savings Opportunity. Once a PID is selected all other tables will update. For parent-child PID relationships, the table only lists the parent PID and name, but the Potential Savings Opportunity amount is for all PIDs in the relationship.
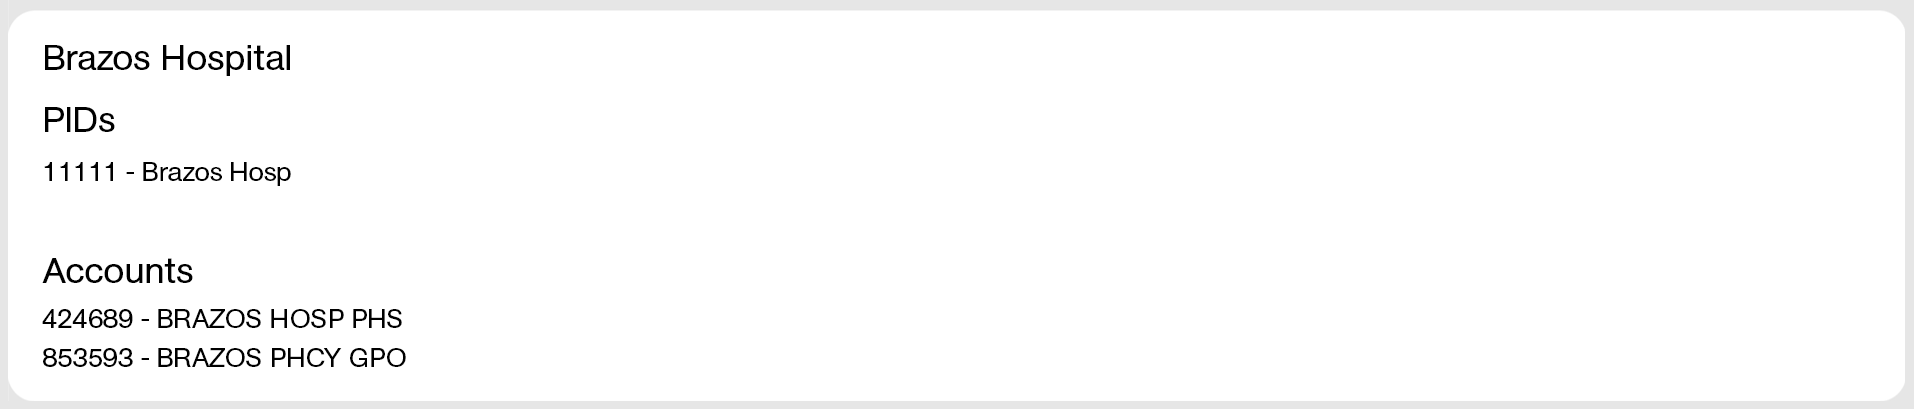
PID Details
After selecting a PID from the Savings Opportunity by PID table, the PID and account details are displayed here. For parent-child relationship PIDs, the parent and child PIDs, names and accounts will be displayed here.
Current Opportunities
An opportunity is an item with potential missed savings due to charge and purchase data not aligning. This is determined by analyzing what potentially could have been purchased on 340B considering total purchase volume compared to the Non-Medicaid Outpatient charge ratio. Opportunities are listed in descending order by the Potential Savings.
- Each opportunity considers the data from 90 days prior to the Date Realized.
- Mixed Use data is recalculated weekly and new opportunities may be added if they exceed the Potential Savings value of those currently presented.
- The table can be viewed by Top 25 or Show All.
Potential Causes for Opportunities
The cause of the potential opportunity cannot be identified directly by 340B Impact and additional investigation will be required to understand the discrepancy. Potential reasons for a variance could include:
- Waste is not being accumulated, causing purchase volume to exceed charge volume
-
Crosswalk issues, including:
- CDMs and charge quantities are not consistent across different areas
- BUPPs are set incorrectly
- Unmatched charges
- Purchases bypassing the split process
- Negative current 340B accumulation balance
- Missing utilization data
- 340B-eligibility exclusions

Current Opportunities Columns Defined
- Quarterly Potential Savings: Missed savings over the prior 90 days resulting from the gap in comparing charge and purchase data for this NDC. If historical trends stay consistent, this represents the potential 90-day savings associated with correcting the issue and shifting the entire Package Opportunity from the default account to the 340B account going forward.
- Package Opportunity: The potential packages that could have been purchased on 340B over the prior 90 days based on a comparison of Total Purchase Qty to the Non-Medicaid Outpatient Ratio.
- NDC: 11-digit drug identifier; the level at which accumulations are maintained in 340B Architect.
- NDC Description: The drug name and dose amount specific to the NDC.
- Non-Medicaid Outpatient %: The total percentage of charges that could potentially qualify for 340B accumulation by being both outpatient and non-Medicaid over the historical 90-day period being analyzed.
- 340B Purchase Quantity: The number of packages purchased on the 340B account over the historical 90-day period being analyzed.
- Default Purchase Quantity: The number of packages purchased on the default account over the historical 90-day period being analyzed.
- Total Purchase Qty: The number of packages purchased on all accounts (including 340B, GPO, and WAC where applicable) over the historical 90-day period being analyzed.
- Total Drug Spend: The total amount spent on all purchases from all accounts (including 340B, GPO, and WAC where applicable) over the historical 90-day period being analyzed.
- Date Identified: The date the opportunity was identified and added to the Current Opportunities table.
Realized Savings by Drug
This table displays the active opportunities that are being tracked for contribution to the Realized Savings, based on the PID selected. The same NDCs may be present in both the Current Opportunities and Realized Savings by Drug tables. However, while data for the Current Opportunities is updated on a weekly basis, the metrics displayed in this table represent the baseline data from the original Date Identified. This baseline is compared to changes in the 340B purchase ratio over time to calculate Realized Savings.
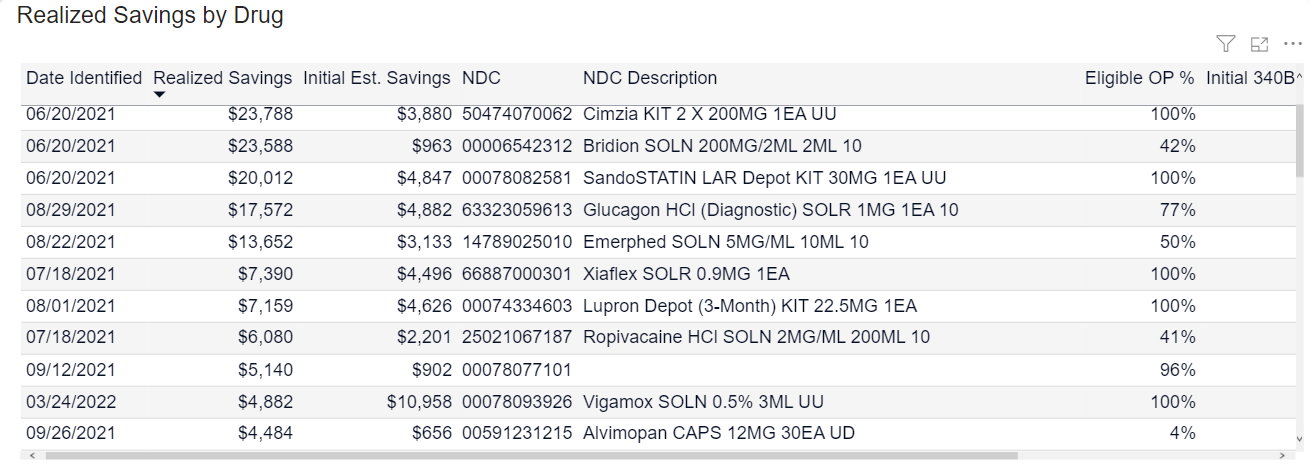
Realized Savings by Drug Columns
- Date Identified: The date the opportunity was identified and added to the Current Opportunities table.
- Realized Savings: The amount of actual savings for tracked mixed-use opportunities.
- Initial Est. Savings: The original quarterly savings estimate calculated from shifting all existing volume for an equivalent group of generic drugs to the identified alternate opportunity. This value will be the same as the Quarterly Potential Savings value in the Current Opportunities Table.
- NDC: 11-digit drug identifier; the level at which accumulations are maintained in 340B Architect.
- NDC Description: The drug name and dose amount specific to the NDC.
- Eligible OP %: The total percentage of charges that could have potentially qualified for 340B accumulation by being both outpatient and non-Medicaid for the 90 days prior to the Date Identified.
- Initial 340B Purchase %: The percentage of purchases made on the 340B account for the 90 days prior to the Date Identified.
- Current 340B Purchase %: The percentage of purchases made on the 340B account after the Date Identified.
 340B Impact Filters Defined