- 340B Impact Overview
- Performance Overview Page
- Drug Spend Page
- Hospital Savings Page
- Net WAC Impact Page
- Retail Performance Page
- Generics Optimization Page
- Mixed Use Optimization Page
- Orphan Optimization Page
- 340B Impact Education Videos
- Account Table Page
-
Updates & Announcements
-
340B Architect
-
340B Impact
-
340B RxCorrelate
-
340B Monitor
-
340B Written Location
-
340B Central Split
-
All About Architect Webinar Series
-
More Resources
-
Right Side Callout
-
Release notes
-
Recent Manufacturer Notices
-
More Videos
Overview
The Net WAC Impact page compares the cost of WAC account purchases to GPO pricing. Only covered entities/hospitals within your health system that have a WAC account and 340B Impact GPO reference pricing will be displayed on this page. The Net WAC Impact page includes hospital and hospital-owned retail/specialty pharmacy data. Contract pharmacy data is excluded from this page.
On this page, you can interact directly with the data in the visuals by hovering over any data point to display more details. Selecting one or more data points updates Current Filters and dynamically updates all visuals.
Learn more about 340B Impact navigation and interaction functions in the article “How to Use 340B Impact”.
Key Metrics

Key Metrics show a high-level overview of your 340B Program performance. All metrics include your hospital and hospital-owned retail/special pharmacy data. Drug Spend also includes contract pharmacy data in addition to hospital data.
Key Metrics defined
- Drug Spend: Total amount spent on all drug purchases.
- Gross Savings: The amount saved on all 340B purchases compared to the GPO catalog prices.
- Net WAC Impact: The impact of all WAC purchases compared to the GPO catalog prices.
- Net Savings: The Health System's net benefit from participating in the 340B program (i.e., Gross Savings plus Net WAC Impact).
The percentage change represents the difference between the start and end data points for the selected date range.
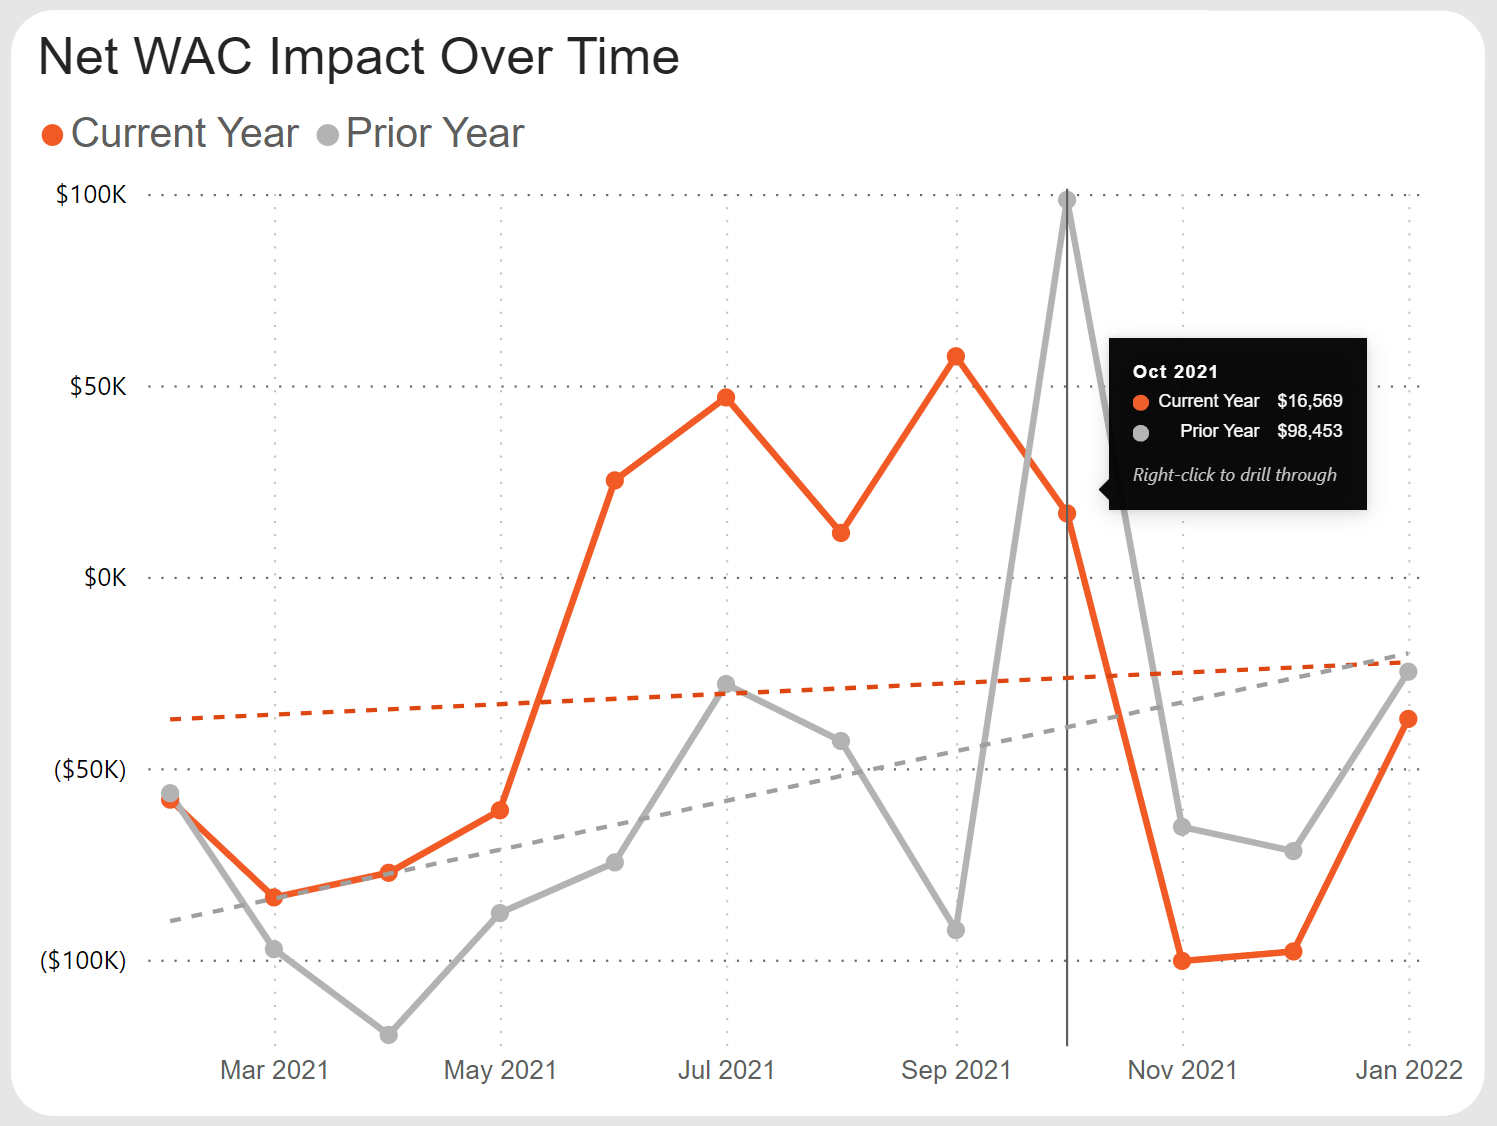
Net WAC Impact Over Time
This graph displays Net WAC Impact trends and compares the values between current and prior years for the selected date range. This makes it easy to see the variations in net WAC impact over time for your health system.
- Current Year: Represents the date range selected.
- Prior Year: Represents data for the year prior to the date range selected.
- Dotted line: Represents the average trend across data points for the selected date range.
Net WAC Impact Across System
This graph shows the Net WAC Impact across your health system. You can use the drill-down and expand features to visually isolate areas of your health system and see more granular details.

Health System Hierarchy
- Hospital: Covered entities that are part of your health system that are participating in the 340B Program.
- Service Type: Identifies different standard areas of your health system’s 340B program, including hospital mixed-use, hospital ambulatory, hospital-owned retail, contract pharmacy retail, contract pharmacy specialty, etc.
- Location: Contract pharmacy chains are grouped together. Customers may also choose to group their hospital outpatient pharmacies together using their account table setup.
- Account: The individual purchasing account used to buy drugs for your 340B Program.
Net WAC Impact By Drug/Category
This table shows Net WAC impact data by drug category. You can isolate drug or drug categories that may be driving WAC purchase trends by using the expand buttons.
By default, this visual will display the data by WAC Premium. From the drop-down you can choose to view by any of the following:
- WAC Premium: Displays all drugs that had a negative WAC impact during the selected date range. This is when more money was spent by purchasing on WAC than on GPO.
- WAC Savings: Displays all drugs that had a positive WAC impact during the selected date range. This is when more money was saved by purchasing on WAC than on GPO.
- Special Targets: Displays drugs identified as special targets by McKesson's 340B consulting team, as they typically present common issues which can be resolved if investigated.
- All: Displays all drugs for the date range selected, with no filters applied. Values displayed are the Net WAC Impact (the sum of WAC Premium and WAC Savings), as defined above.
As a reminder all Current Filters affect the data displayed in this table.
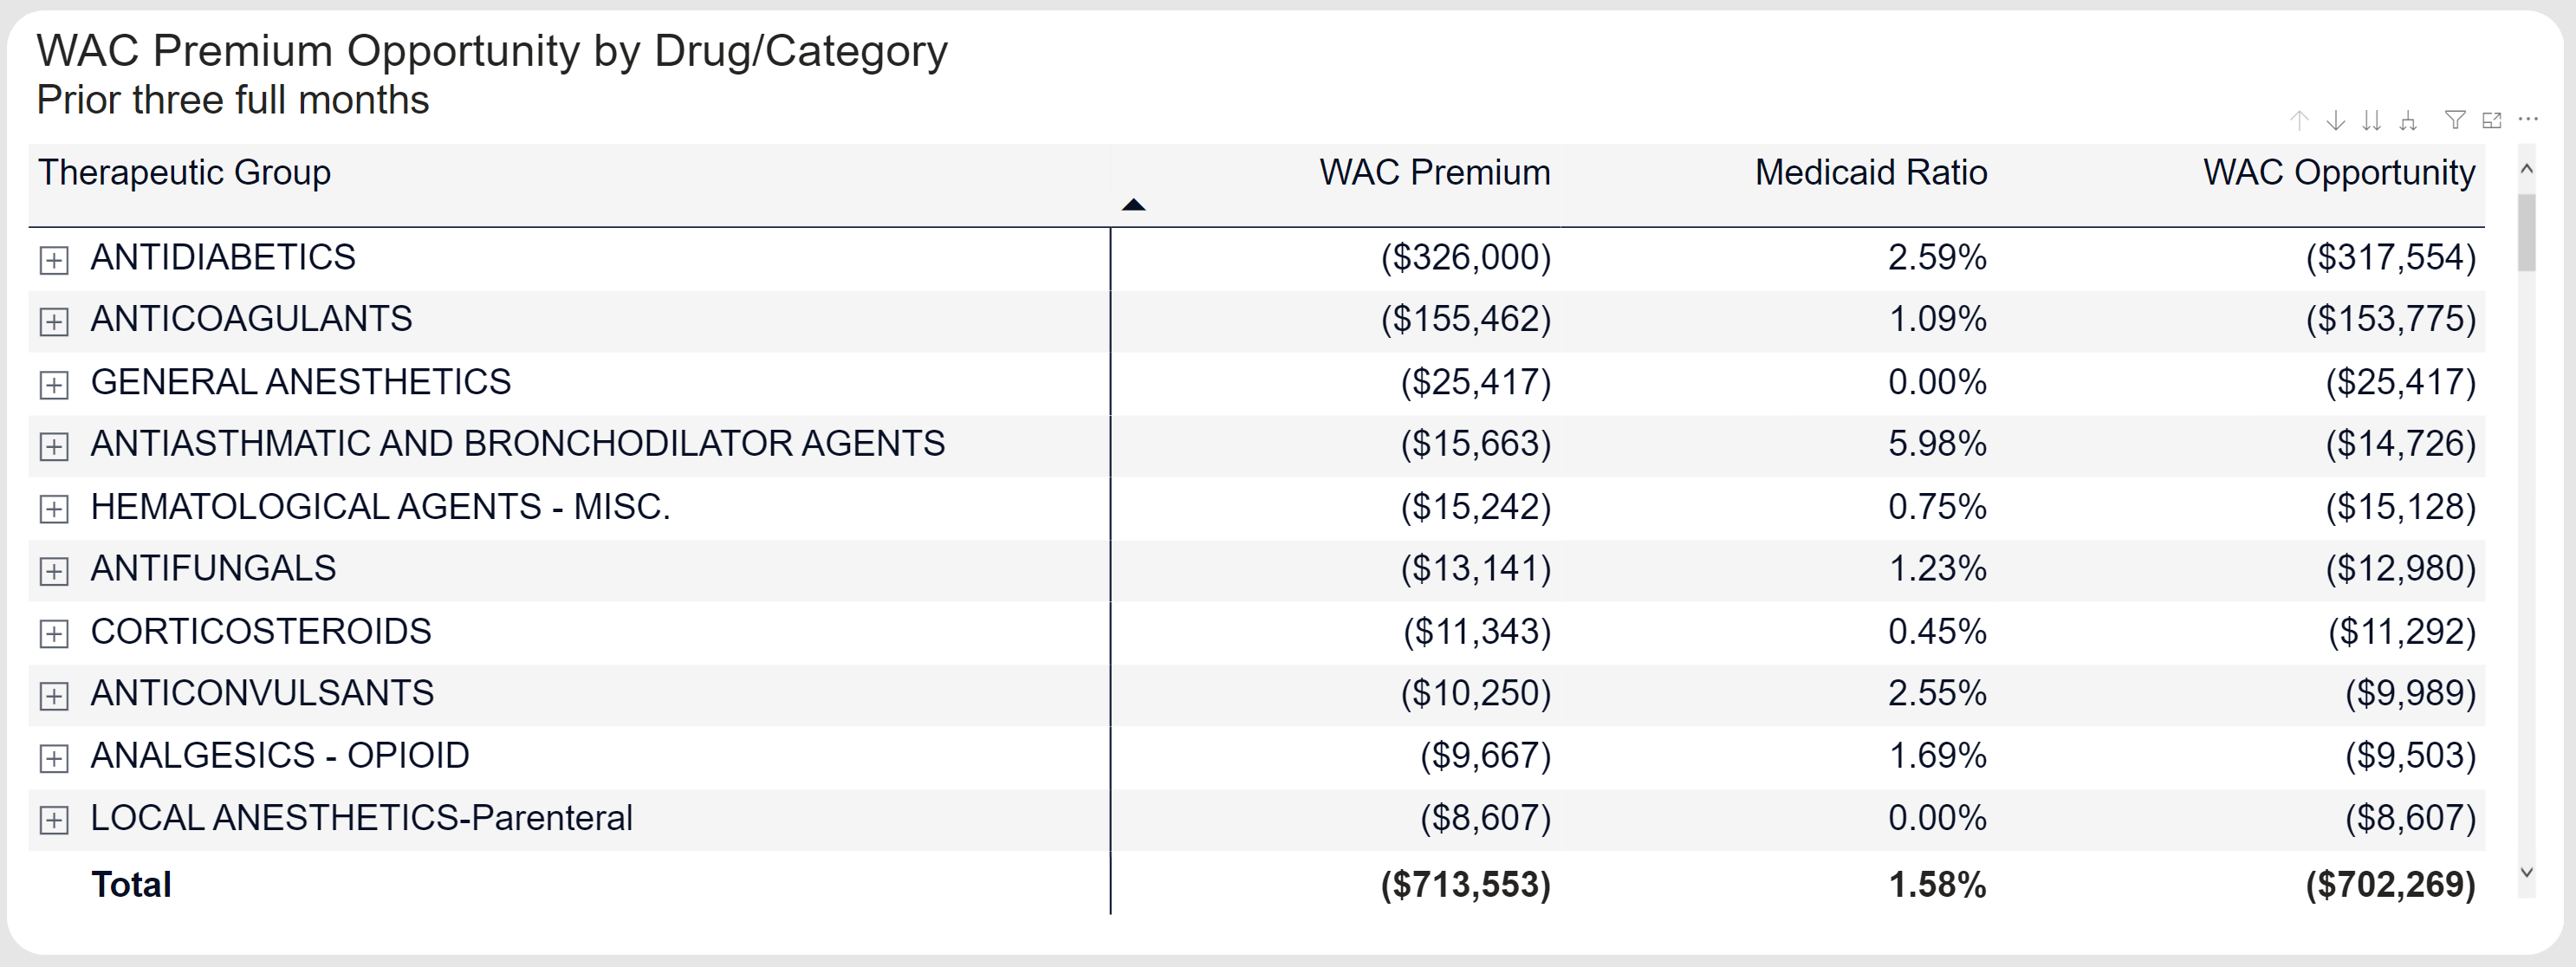
WAC Premium Opportunity by Drug/Category
This table displays opportunities based on the prior three complete calendar months to minimize WAC Premium for covered entities that carve-out Medicaid. You can isolate drug or drug categories that may be driving recent, actionable WAC Premium by using the expand buttons. If a covered entity is carving-in Medicaid, the Medicaid Ratio throughout the hierarchy will be zero, which results in WAC Opportunity equal to WAC Premium.
- WAC Premium: Negative Net WAC impact by Drug/Category. This is when more money was spent by purchasing on WAC than on GPO.
- Medicaid Ratio: The percentage of the total charges that were considered Medicaid (MHI Medicaid = Y in Utilization Manager) and were excluded from 340B qualification.
- WAC Opportunity: Negative Net WAC impact by Drug/Category excluding the Medicaid Ratio. This is the potential opportunity after considering the Medicaid Ratio.
Drug Category Hierarchy
- Therapeutic Group: General drug groups frequently used in general market research and third-party prescription processing, for example, Penicillins, Contraceptives, and Anti-Diabetics.
- Therapeutic Class: Specific therapeutic drug classes designed to accommodate more detailed market research, for example, Carbonic Anhydrase Inhibitors, Loop Diuretics, and Mercurial Diuretics.
- Drug Name: The generic or chemical name of a drug, for example, Dexamethasone Acetate and Dexamethasone Sodium Phosphate.
- Brand Group: The brand name of a drug when applicable.
- NDC: 11-digit unique drug identifier; the level at which accumulations are maintained in 340B Architect.
 340B Impact Filters Defined