-
Updates & Announcements
-
340B Architect
-
340B Impact
-
340B RxCorrelate
-
340B Monitor
-
340B Written Location
-
340B Central Split
-
All About Architect Webinar Series
-
More Resources
-
Right Side Callout
-
Recent Manufacturer Notices
-
More Videos
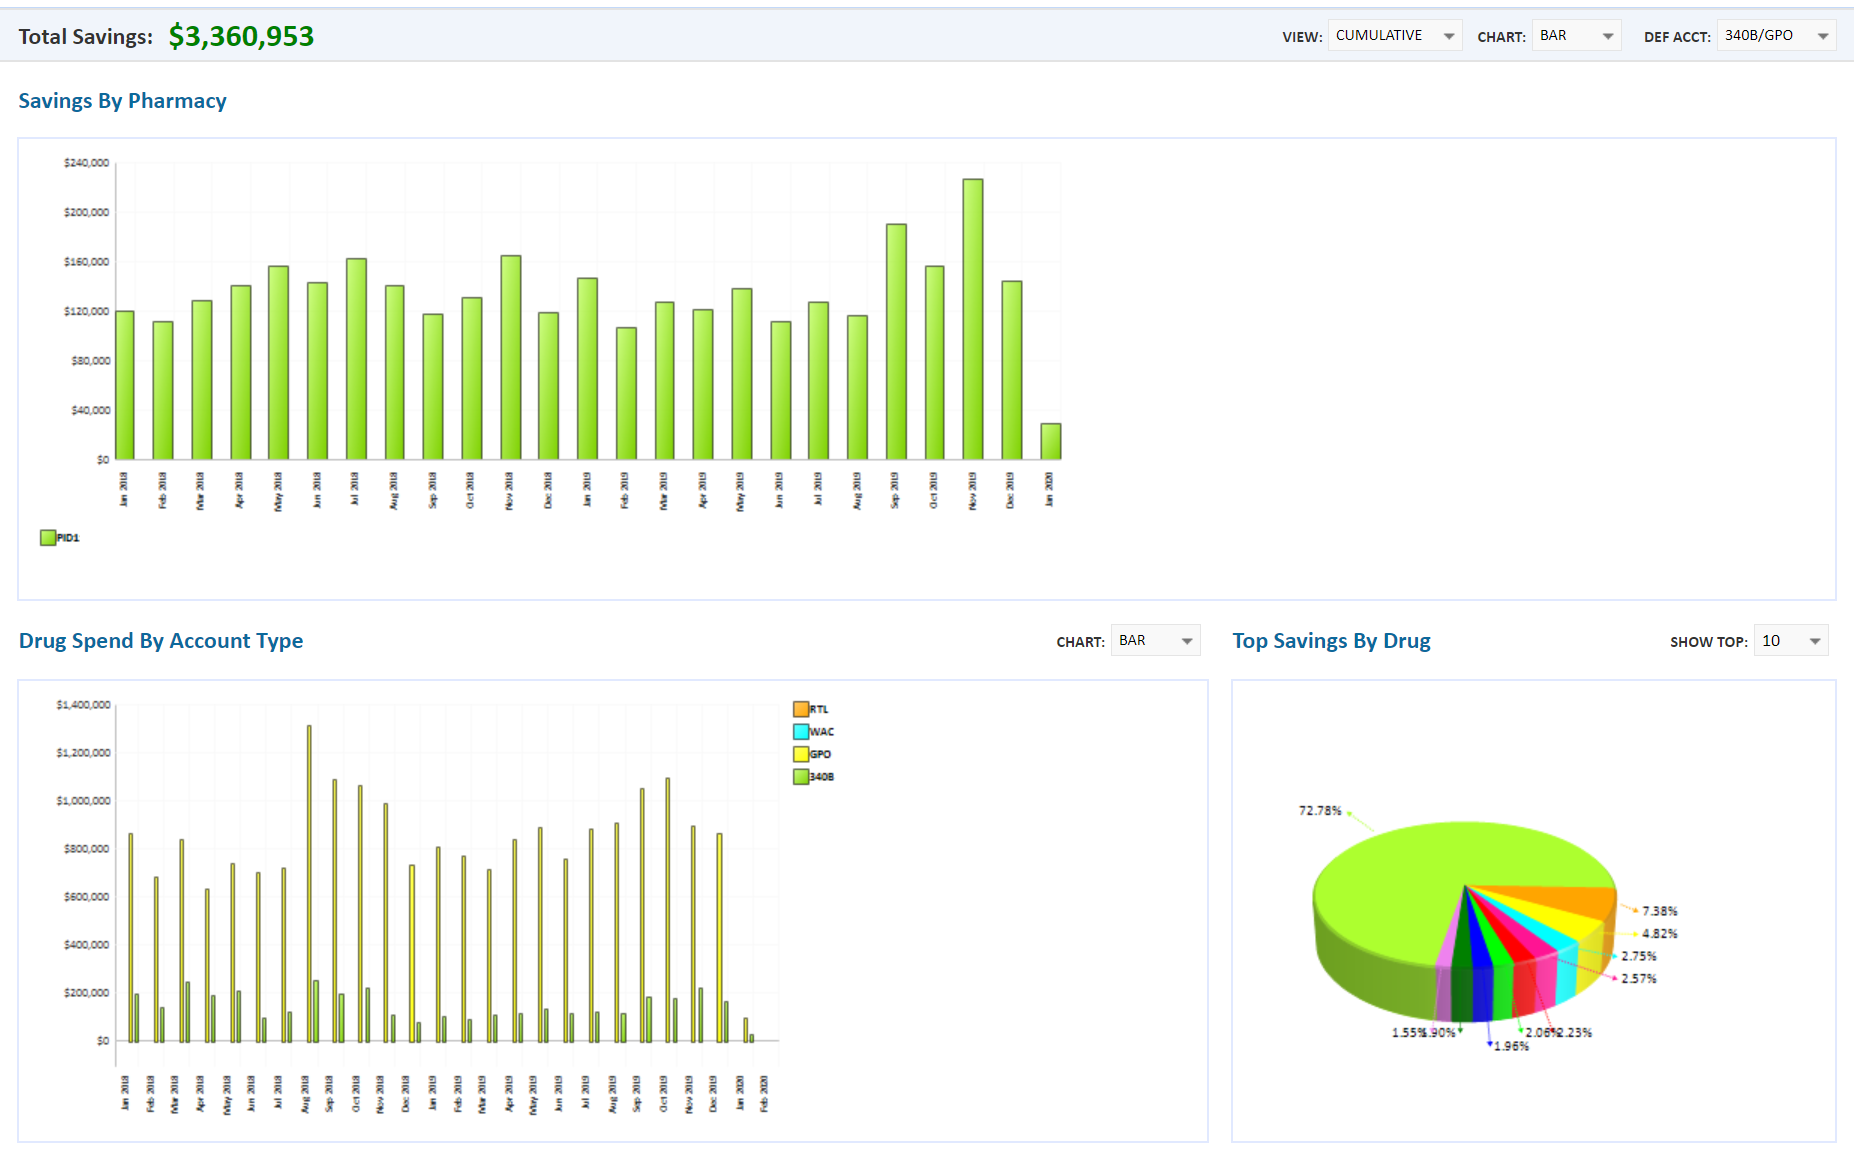
Overview
The Pharmacy Dashboard page displays drug savings and drug spend by pharmacy.
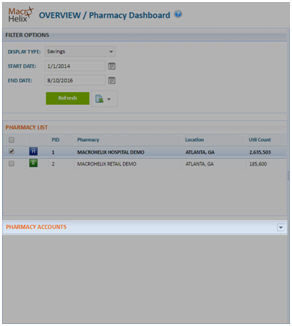
You can use the Filter Options panel (left panel) to change the display type and set start and end dates for the data.
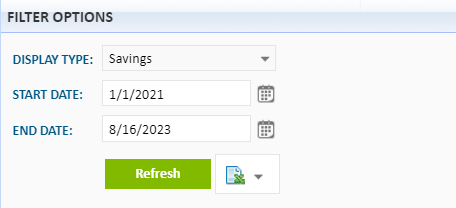
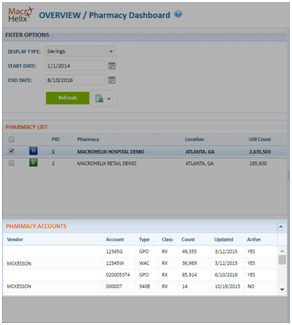
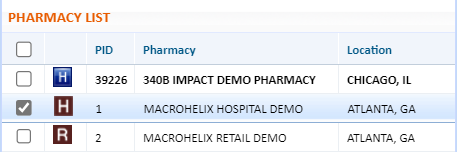
By default, the Pharmacy Accounts panel (left panel) will be collapsed. You can choose to expand to see a list of account by clicking the drop-down arrow.
Drug Savings by Pharmacy
This chart displays pharmacy drug savings by month depending on the DEF ACCT (default account) option selected. The below selected option is 340B/GPO. Savings are calculated by subtracting the 340B price from the GPO price and multiplying the result by 340B purchased packages for a drug packages for a drug. Use the Pharmacy List panel to compare savings and spend data between pharmacies, if applicable up to three pharmacies.
DEF ACCT available options:
- 340B/GPO savings = 340B purchase packages x (GPO price - 340B price)
- 340B/WAC savings = 340B purchase packages x (WAC price - 340B price)
- 340B/RTL savings = 340B purchase packages x (RTL price - 340B price)
- GPO/WAC savings = GPO purchase packages x (WAC price - GPO price)
- 340B/GPO + WAC/GPO = 340B purchase packages x (GPO - 340B price) + WAC purchase packages x (GPO - WAC price)
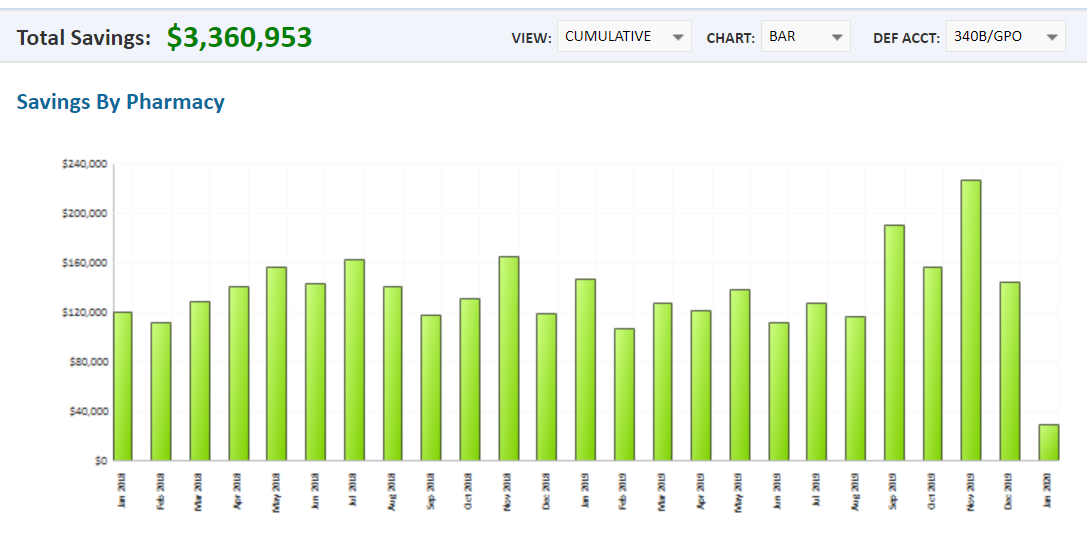
How to Update the Chart Display
Switch between Cumulative and Comparative displays from the View drop-down menu:
- Cumulative displays data the pharmacy you are accessing.
- Comparative allows you to select other pharmacies from the Pharmacy List panel on the left side of the page. Select the check box beside each pharmacy you want to include in the comparison.
You can also change the Chart type and accounts displayed:
- Switch to another chart format by selecting an option on the Chart drop-down menu: Bar or Line. Bar is the default display.
- Select an account configuration from the Def Acct drop-down menu. Your default account setup is pre-populated (e.g. 340B/RTL).
Drug Spend by Account Type
This chart compares drug spending by month for your pharmacy's 340B and GPO accounts (includes WAC account, if applicable).
Switch to another chart format by selecting an option on the Chart drop-down menu: Area, Bar, or Line. Bar is the default display.
Top Savings by Drug
This chart displays the top drug savings by month for up to 20 drugs.
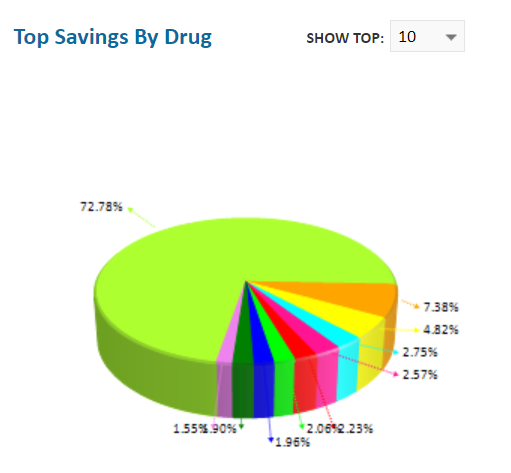
Adjust the number of drugs displayed in the Show Top drop-down menu: 5, 10, 15, 20. The default display is 10 drugs.
 View Accumulation Details